
Friday, March 31, 2006
New Wave as requested by feniz

Critical and immediate support is 21.5 cents as shown by the green dotted line. Next support is the pink line at 20 cents. RSI hovering just slightly above the oversold border of 30%. Stochastics in oversold region but no buy signal yet. Immediate resistance is 23 cents indicated by the red dotted line. Gap resistance at 23.5 cents followed by downtrend line resistance at 24 cents. Major resistance at 24.5 cents as denoted by the bold green line and also the 20 days close simple moving average.
Guthrie weekly chart as requested by Prime
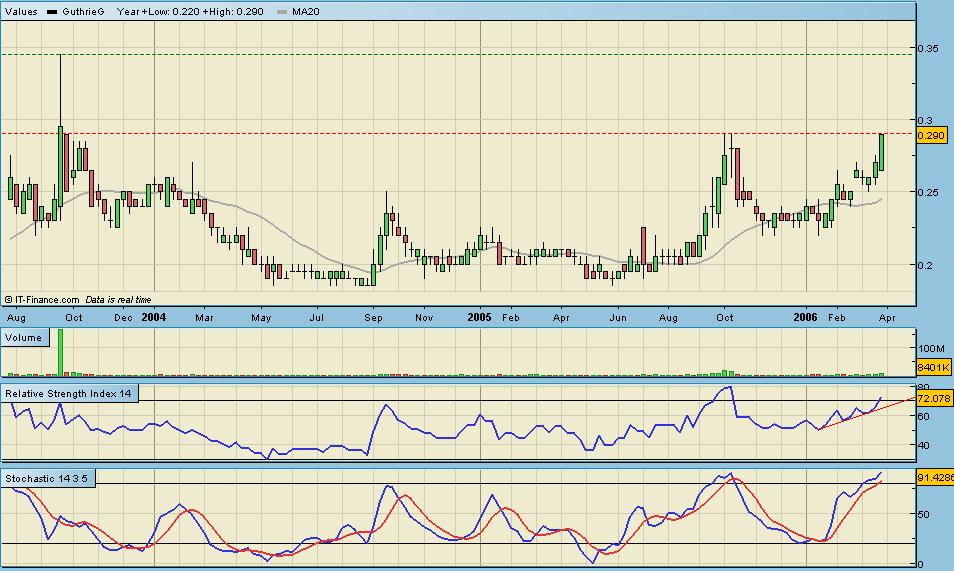
After rebouncing from the 25 cents gap support price is now testing the high of 29 cents set in October 2006.Weekly RSI just moved slightly above the 70% overbought border. Weekly stochastics in overbought region. Breakout above 29 cents as shown by the red dotted line will see a test of 34 cents the high set in September 2003 as indicated by the green dotted line.
Thursday, March 30, 2006
Multi-Vision as requested by pharmahunter

Bollinger band tightening and going to explode soon. RSI making higher highs and higher lows. Immediate resistance is 14.5 cents as shown by the blue line. Breakout above 14.5 cents will see a test of 15.5 cents resistance which is also the 50 days close simple moving average resistance. Immediate support is 13.5 cents indicated by the red dotted line. Next support level is 13 cents the green dotted line. Will probably trade between 13.5 cents to 15.5 cents the next few days. Chart as per time stamped.
Wednesday, March 29, 2006
CG Tech as requested by Larry
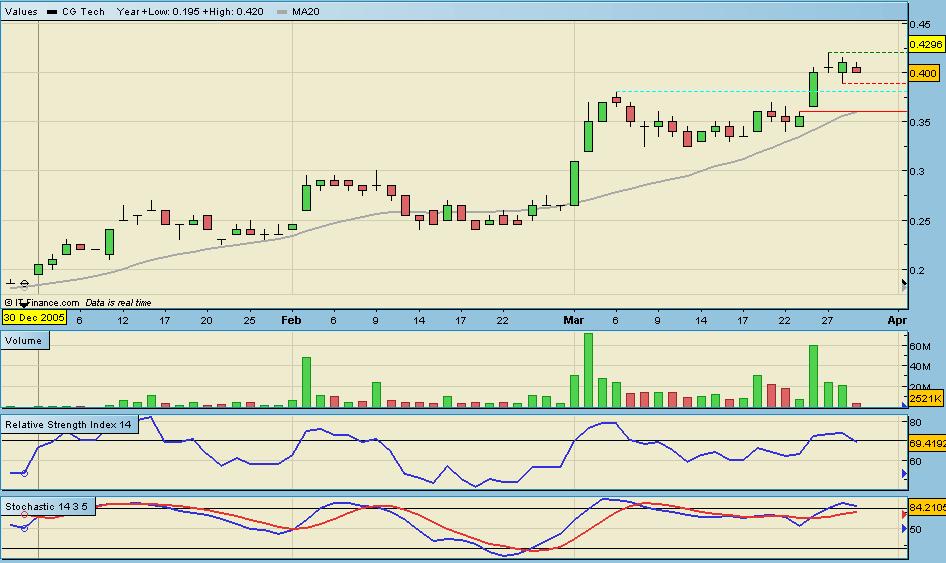 Immediate resistance and also record high is 42 cents the top of the doji as shown by the green dotted line. RSI and stochastics turning down. Volume decreasing. Immediate support is 39 cents as indicated by the red dotted line. Next support is at 38 cents. Gap support and 20 days close simple moving average is at 36 cents as shown by the red line. Probably will trade between 42 cents to 38 cents the next few days. Chart as per time stamped.
C & O Pharm as requested by pharmahunter

Resistance at 48 cents tested 4 times since 21st March 2006. Record high of 48.5 cents was achieved on 27th March 2006 and tested again this morning. RSI hovering just below the 70% overbought border. Stochastics in oversold region but not a useful tool in strong trend. Immediate resistance 48.5 cents. Immediate support 46 cents. High probability of another new record high being achieved.
Tuesday, March 28, 2006
HL Asia

Broke out upwards back above $1.45 resistance. Broke thru $1.48 resistance and 20 days close simple moving average .RSI and stochastics showing favourable signals. Immediate support $1.48. Immediate resistance is $1.55.
HG Metal as requested by Ellen
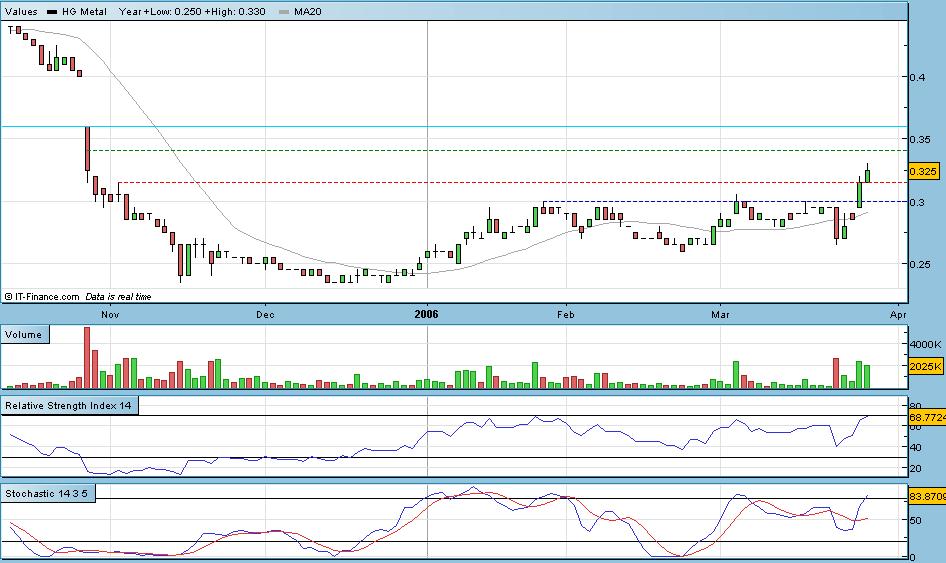
Broke out above 30 cents yesterday. Broke out again this morning above 31.5 cents. RSI still below oversold region. Stochastics just move up into oversold region. Volume increasing as price increases. High probability of closing the gap at 40 cents if selling can be absorbed by the buyers in the next few days. Immediate resistance is 34 cents as shown by the green dotted line. Next resistance is 36 cents indicated by the light blue line. Immediate support is 31.5 cents as denoted by the red dotted line. Chart as per time stamped.
Noble as requested by scusa
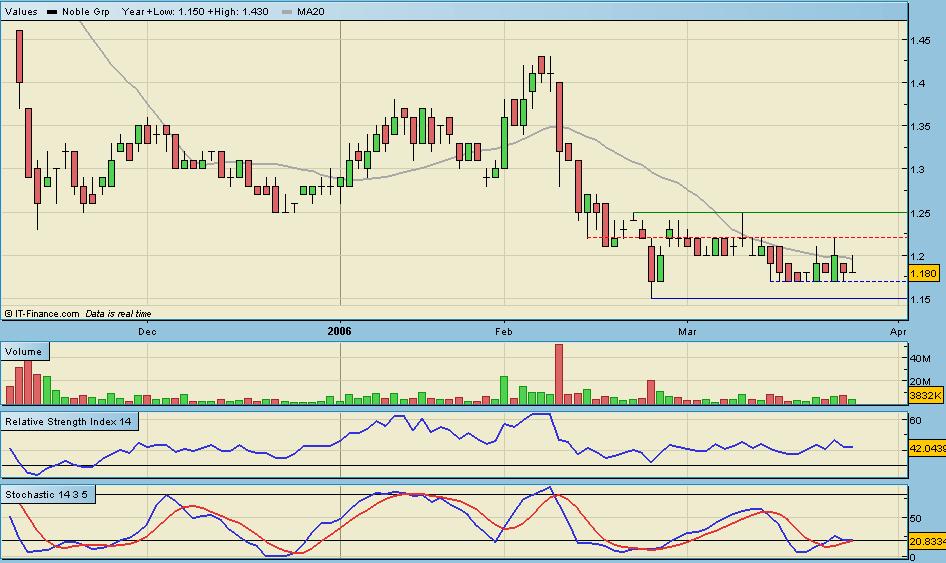
More range trading between $1.22 as indicated by the red dotted line and $1.17 as shown by the blue dotted line. RSI flat and lacks direction. Stochastics hovering along the oversold 20% border. Immediate resistance is $1.22. Next resistance is $1.25 as denoted by the green line. Breakout above $1.25 will see a move towards $1.30. Immediate support is $1.17. Next support is $1.15.
Monday, March 27, 2006
LifeBrandz weekly chart as requested by Ellen

Since IPO price has been falling steadily and forming a hugh falling wedge. Price trying to breakout above the upper wedge. Weekly RSI and stochastics still dropping. Need breakout above the resistances at 8 cents shown by the blue line and 9 cents shown by the green line before it can established a strong base for reversal. Immediate resistance is 7 cents. Immediate support is 5.5 cents. Next support is 5 cents. For FA detail analysis please see Gallen at http://kelongstocks.blogspot.com
C & O Pharm as requested by Ellen

Uptrend still intact as long as blue dotted line at 44.5 cents holds. RSI slightly weak. Stochastics hovering in oversold region since 7th March 2006. Stochastics is not a useful technical tool in strong trends. Immediate support is the red dotted line at 46 cents. Immediate resistance is the record high at 48 cents.
Datacraft as requested by Urgent

Downtrend since 8th March 2006 when the hammer candlestick broke down thru the bold blue uptrend line. Since that day price has never closed above the 20 days close simple moving average. RSI still in downtrend as shown by the green line on the RSI chart. Stochastics stuck in oversold region because it does not work well in strong trends. Immediate resistance is $1.12. Next resistance is the 20 days close simple amoving average at $1.13. Breakout above $1.14 will see price move up to retest the blue sloping uptrend line. Immediate support is at $1.08. Next support is $1.05. Lets see which direcion the doji will taken tomorrow.
Sunday, March 26, 2006
China Life as requested by Andrew

Ascending triangle breakout above 26.5 cents with high volume. RSI turning up but still below 70% and looks very interesting. Stochastics also turning up. Immediate support is 27.5 cents as shown by the red dotted line. Next support is 26.5 cents the blue dotted line. Immediate resistance is 29 cents. A new record high is very likely to be set tomorrow.
China Wheel as requested by Andrew
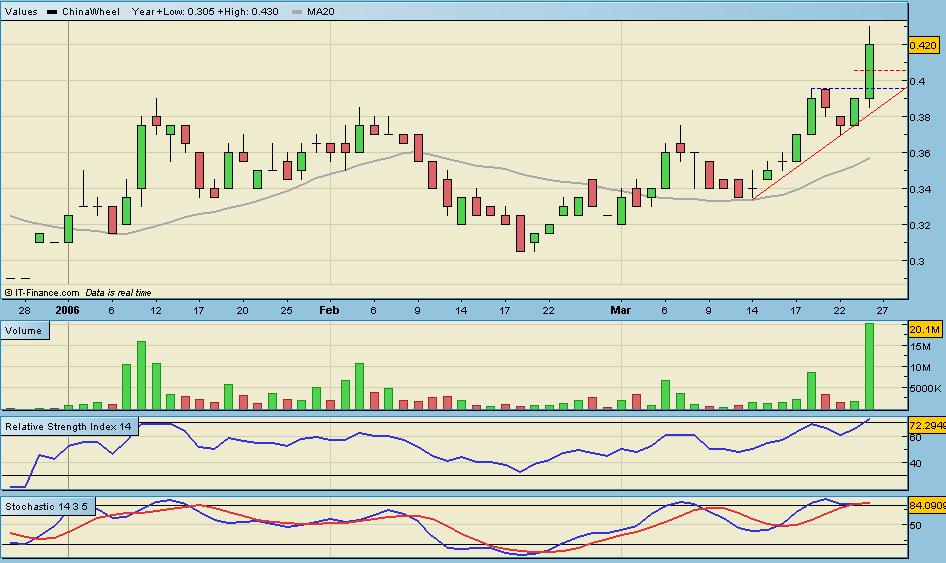
Breakout at above 39.5 cents with high volume. RSI just moved into oversold area slightly above 70% border. Stochastics in oversold region. If 42 cents closing level cannot hold price will drop to the red dotted line mid candlestick support at 40.5 cents. Immediate resistance is the record high of 43 cents. New record high maybe achieve tomorrow. Breakdown thru 39.5 cents support shown as the dark blue dotted line will need reassessment.
Saturday, March 25, 2006
Federal as requested by feniz
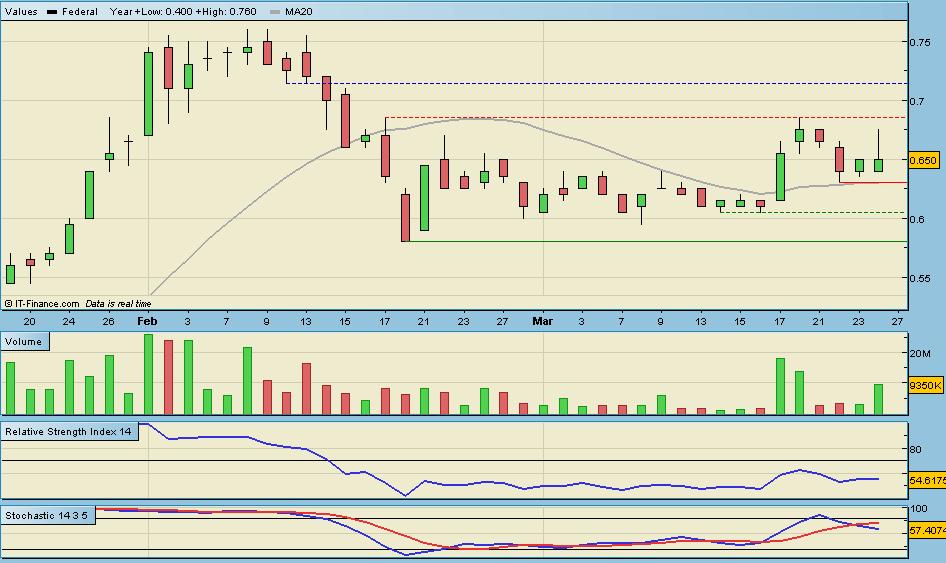
Potential inverted hammer. Need confirmation on Monday closing candlestick. RSI flat and stochastics weakening. Volume increasing. Immediate support is 63 cents which is also the 20 days close simple moving average support. Immediate resistance is 68.5 cents as shown by the red dotted line. Next resistance is 71.5 cents. Next support is indicated by the green dotted line at 60.5 cents. Price will probably be trading within the immediate resistance and immediate support levels.
Memory Device as requested by feniz

Price met the dark blue downtrend line at 49 cents and dropped to close at 48 cents. This is the 2nd inside day bar since 22nd March 2006. Price will probably trade within the high of 49.5 cents to a low of 46 cents next week. RSI and stochastics looking weak. Immediate resistance is the dark blue downtrend line. Next resistance is 49.5 cents the green dotted line. Immediate support is the 46 cents as shown by the red line. Major support is at 45.5 cents indicated by the green line. 45.5 cents is also the 20 days close simple moving average support. Breakdown from 45.5 cent will require reassessment.
Friday, March 24, 2006
Landwind

Breakout from 42 cents resistance. Old resistance has now become the new support.Volume has increased tremendously. RSI has turned upwards but still below the oversold border of 70%. Stochastics in oversold region. The 50 days close simple moving average has now become a support line at 41.5 cents. Immediate resistance at 44 cents as shown by the green dotted line. Since clearing 41.5 cents a double bottom formation has been confirmed with a projected target of 46.5 cents.
SPH

Taking reference from the candlestick formation on 21st March 2006, the last 2 days were inside days bars. Price will probably be trading within the high set on 21st March 2006 which is $4.52 as shown by the green dotted line and the low of the same day which is $4.42 shown by the dark blue dotted line. RSI turning down. Stochastics turning up slightly but no buy signal yet. Immediate resistance is the 20 days close simple moving average at $4.48. Move up above $4.48 will retest resistance at $4.52 . Immediate support is $4.42. This support has been tested 4 times since 16th March 2006. Breakdown from $4.42 will bring price down to the next support at $4.36.
Thursday, March 23, 2006
China Sun

Testing short-term uptrend support line indicated by the red line. Just broke thru 20 days closing moving average support . Breakdown thru 64.5 cents red line support will test the next support at 63 cent shown as the dark blue dotted line and 62.5 cents the dark blue line. Immediate resistance is 68.5 cents. Next resistance is the gap resistance at 69.5 cents. The ability to fill and breakout upwards from this gap resistance will demonstrate that there is still more upward momentum. However, should the 62.5 cents support breaks price will probably retrace to 57.5 cents. Chart as per time stamped.
Asia Env as requested Johntan2727

After breaking out above 32 cents and making a high of 33.5 cents yesterday price drop back immediately below the 32 cents support. This support is now the new resistance. Stochastics turning down slightly but RSI turning up slightly. Breakout above 32 cents will see retest of all time high of 34 cents. Immediate support is 30 cents.
Wednesday, March 22, 2006
Global Test as requested by Dindonbell

Both RSI and Stochastics looking good. Will probably trade between the new support at 30 cents as indicated by the red dotted line and 32.5 cents as shown by the dark blue dotted line the next few days. Immediate resistance is 31.5 cents and immediate support is 30 cents. Chart as per time stamped.
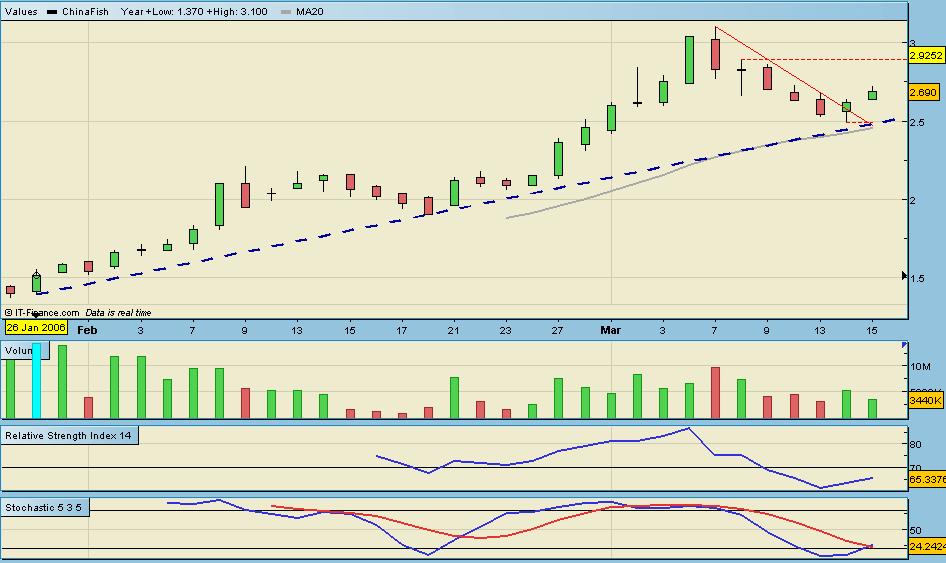
China Fish as requested by Anonymous

Take note of four important supports. First support is $2.64 shown as the green dotted line. Second support is $2.62 the 20 days closing simple moving average. Third support is $2.60 which is indicated by the green line. The fourth and final major support is $2.50 shown as the dark blue line. Breakdown from $2.50 will require reassessment. Immediate resistance is $2.77 . Breakout above $2.77 will see price move to retest $2.89. Chart as per time stamped.
Tuesday, March 21, 2006
NOL as requested by Andrew

Price broke thru the resistance at $2.17 as shown by the red dotted line. It closed yesterday exactly at $2.24 the low of the candlestick formed on 2nd March 2006 as indicated by the dark blue dotted line. This old support line is the immediate resistance that price must overcome to proceed further up. Next resistance to take note is the 20 days close simple moving average at $2.28. Breakout from $2.28 will see retest of $2.34 indicated by the green dotted line and $2.45 shown as the orange line. RSI, stochastics and MACD signals looking very favourable. Price may fluctuate bewtween immediate resistance at $2.24 and immediate support at $2.17 before moving up.
Monday, March 20, 2006
New Wave Tech as requested by johntan2727

Since 6th March 2006 price has been trading in a narrow congestion band between 24.5 cents and 25.5 cents. No significant increase in volume so far during this congestion period. RSI turned up slightly due to 0.5 cents higher closing. Stochastics no buy alert yet. Need to breakout above 26.5 cents as shown by the green line. Will probably see more range trading this week unless strong bulls or bears take control. Immediate support is the gap support at 24 cents.
Sunday, March 19, 2006
China Fish as requested by Anonymous

Uptrend still valid as long as $2.50 as shown by the red line holds. 20 days closing moving average support is now at $2.52. Price will probably trade between the immediate resistance at $2.72 as indicated by the dark blue dotted line and the immediate support at $2.60 as shown by the red dotted line. RSI still below the oversold border and looking neutral. Stochastics still no crossover. Breakout above $2.72 will see price moving to retest $2.89 as indicated by the green line.
Saturday, March 18, 2006
HL Finance as requested by Ming
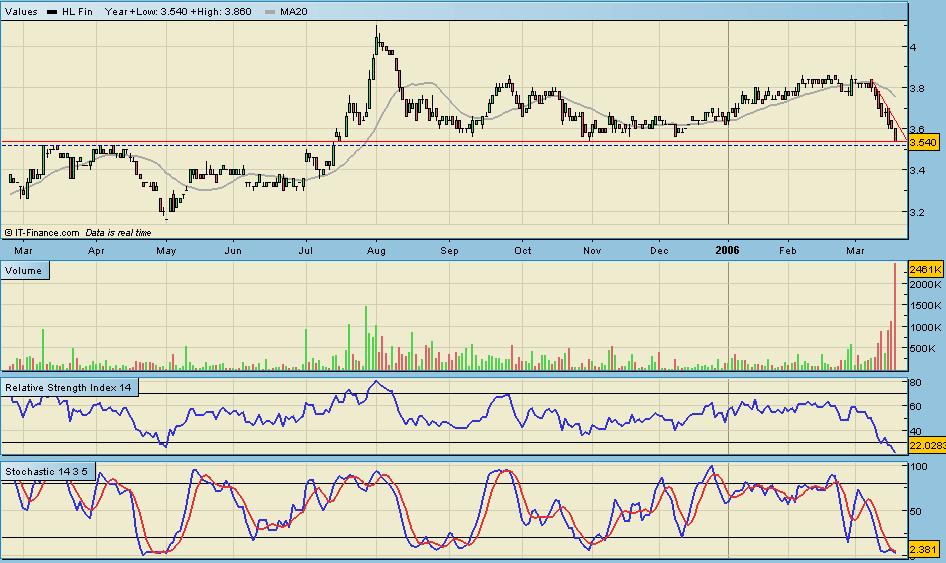
Since 8th March 2006 price has been dropping almost everyday. Huge increase in volume as price continues to drop and move downwards towards the old resistance formed on 4th and 8th April 2005 at $3.52. This former resistance as shown by the dark blue dotted line will be the next support , should the current immediate support indicated by the red line breaks. Since both these 2 lines are only 2 cents apart there is a high possibility of price dropping to $3.48 should the current red line support breakdown. RSI and stochastics are both in oversold regions but no buy signals yet. High probability of a short term technical rebounce.
Rotary as requested by JamesT
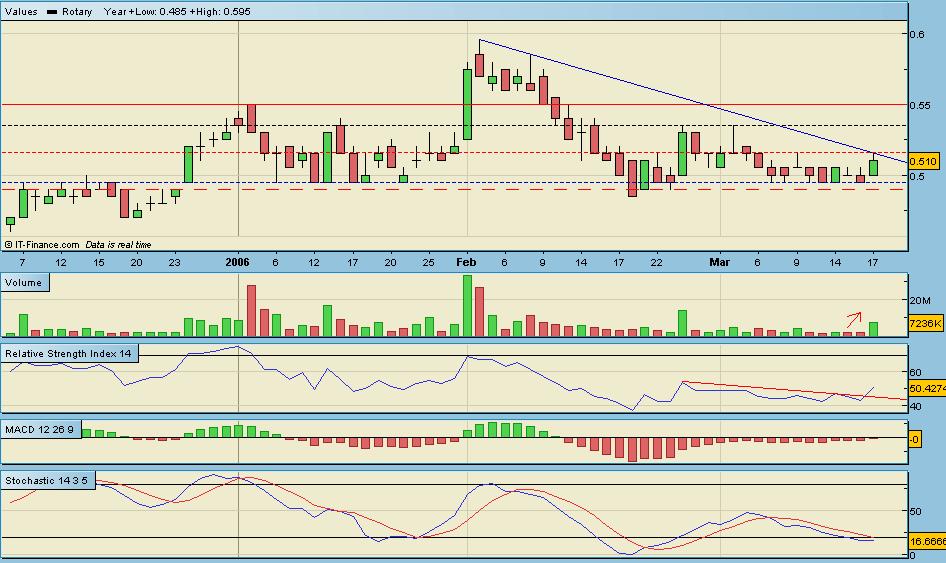
Rotary tested resistance at 51.5 cents but failed to breakout. Volume has increased as price broke thru the minor resistance at 50.5 cents. RSI is leading and signals a buy. MACD still lagging but looks like at the verge of triggering a buy signal on Monday. Stochastics still waiting for crossover buy signal. Immediate support is 49.5 cents as shown by the dark blue dotted line. Immediate resistance is 51.5 cents. Next resistance will be 53.5 cents as shown by the black dotted line. An interesting week ahead for this stock.
Friday, March 17, 2006
China Essence as requested by Andrew

Immediate support is 55.5 cents the dark blue dotted line which is the mid-point of the long green candlestick formed on 1st March 2006. Immediate resistance is 57.5 cents the high of yesterday's doji. Another doji at current price showing indecision. RSI turning up and stochastics crossover signal alert at current price. Breakout above 57.5 cents will see price moving to retest the resistance at 59 cents the black dotted line.
Ferrochina as requested by Andrew

A new high of 76 cents was achieved again this morning after breaking thru the previous high of 75.5 cents. Daily RSI and stochastics forming ranges along the overbought borders of 70% for RSI and 80% for stochastics. Immediate support is at 70 cents the dark blue bold trendline. Uptrend is still valid as long as the 67.5 cents lower red dotted line as shown in the chart holds. Chart is as per time stamped.
Thursday, March 16, 2006
Aztech as requested by Ming

After rising more than 16% since breakout above 21 cents to 24.5 cents this morning, a pullback to the mid-point of the previous long green candlestick at 22.5 cents has occurred. 22.5 cents the current low today is the immediate support with 24.5 cents the current high achieved this morning as the immediate resistance. Price will probably trade between 24.5 cents to 22.5 cents the next few days.
Wednesday, March 15, 2006
China Fish as requested by Anonymous
Uptrend still valid. Yesterday's low of $2.50 is the immediate support. $2.89 high formed by the doji on 8th March 2006 is the immediate resistance. RSI turning upwards and stochastics just crossover. All analysis based on chart as per time stamped. Reassessment will be done using end of day data.
China Hong Xing - Review

Chart as per time stamped showing breakout above $1.16. The previous 2 doji candlesticks showing indecision has now turned more postive with the current candlestick formation. A closing price at $1.16 and above is high possibility. Both RSI and stochastics are currently showing very encouraging signals. High probability of a retest of the all time high top of $1.30 .
Tuesday, March 14, 2006
Landwind as requested by Feniz

At first glance saw a potential head and shoulder formation, was a bit puzzle because they normally occur at the top after an uptrend. Therefore this chart is not the classic model of a normal head and shoulder. Price must break down thru the red dotted line to confirm the head and shoulder formation. If price can breakout above 41.5 cents the high of the right shoulder RS then this formation will no longer be valid. Once again, I must emphasis that this is not the classic normal head and shoulder formation.
Bullish Engulfing pattern formed today together with RSI v-hook formation. Stochastics crossover at oversold region with slight increase in volume. High probability of price testing 39.5 cents resistance and moving to 41.5 cents. Immediate support is the low of 20th February 2006 which is 36.5 cents.
Sunning Tech Daily Chart as requested by Neroli

Both daily RSI and stochastics are in oversold region. Better to use the weekly charts for more accurate interpretations of buy signal. Down trend pressure showing slight relief today as can be seen from the tiny doji formation. Better to wait for end of day formation. Need to monitor further for more positive technical signals. Chart is as per time stamped.
Sunning Tech as requested by Neroli
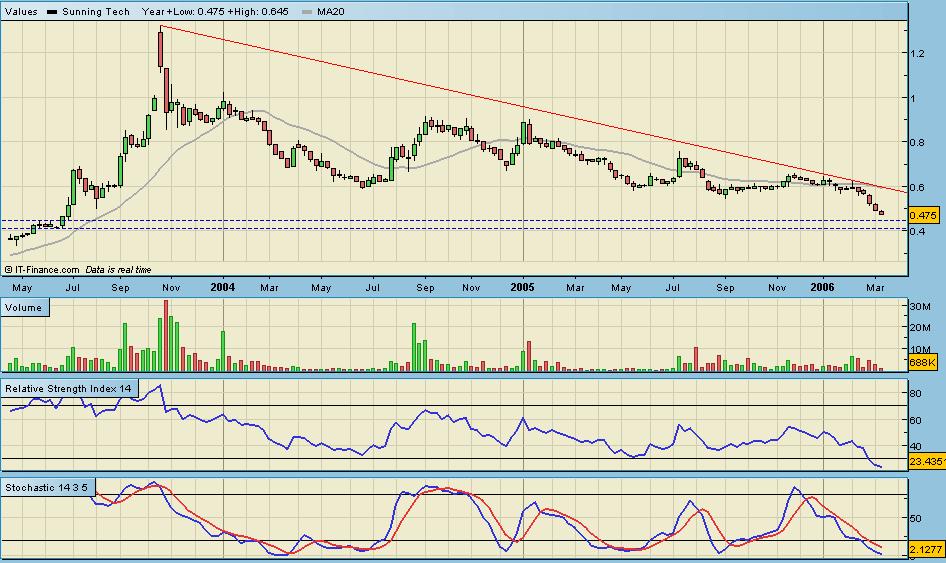
Weekly chart posted. Both Weekly RSI and stochastics are in oversold region. Tentative support region is 44.5 cents to 41.5 cents. No buy signal yet for weekly chart. Will post daily chart later got to attend a meeting now.
Monday, March 13, 2006
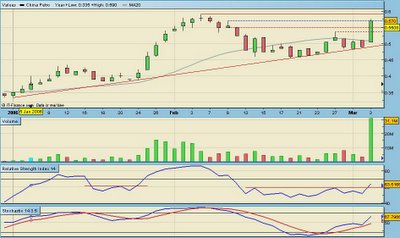
China Petro - Review

Since my last posting price has pierced thru the 59 cents resistance 3 times. The third time it did this was this morning. RSI support still holding. Stochastics %K just cross back above %D. The ascending triangle will be invalid if breakout does not happen by the time it reaches its apex.
Advance Holding as requested by Anonymous
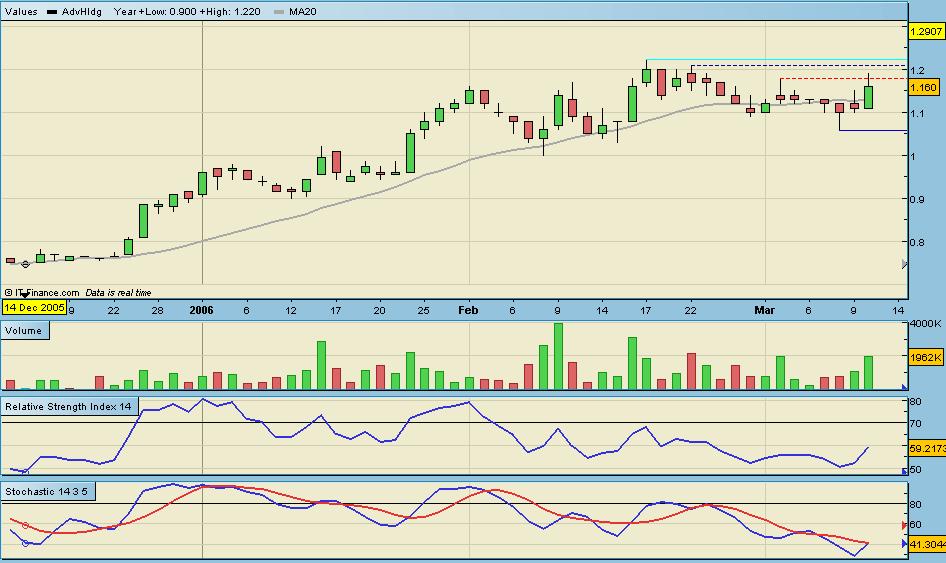
On 8th March 2006 a hammer was formed with tail support at $1.06. An inverted hammer was formed the next day and then a bullish belt hold on Friday managed to pierce thru the $1.18 resistance level as shown by the red dotted line in the chart. However, price failed to close above this resistance line and ended the day at $1.16. There is a high possibility that a retest above $1.18 will happen today and proceed to advance to $1.21 and the all time high of $1.22. Immediate support is the hammer tail at $1.06 as shown by the bold dark blue line in the chart.
China Sky as requested by Andrew
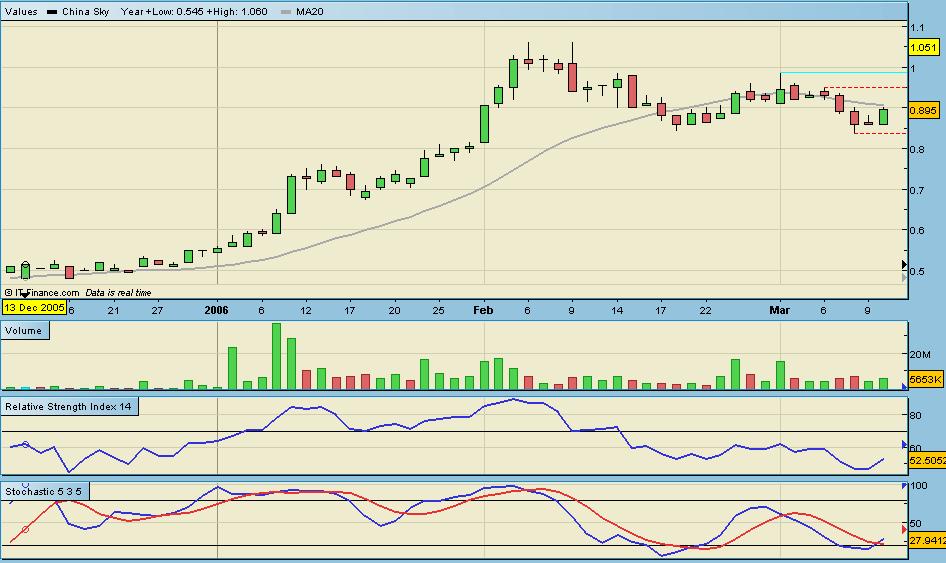
Tiny inverted hammer with bullish green candlestick forming bullish engulfing pattern. Stochastics buy alert signal triggered. RSI turning upwards. Breakout above the 20 day simple moving average at 90.5 cents will see price advancing to test 95 cents and possibly 98.5 cents. Immediate support is 84 cents.
Sunday, March 12, 2006
China Hong Xing as requested by Andrew

Trading has been contained within the range set up by the belt hold candlestick formed on 1st March 2006. The high of this bar was $1.30 and the low was $1.04. On 8th March 2006 price drop to $1.05 almost testing the $1.04 support, it then formed a hammer like candlestick with a small upper shadow high of $1.16. $1.16 is now the immediate resistance that the present bullish engulfing pattern must overcome before it can test the all time high of $1.30. Immediate support is $1.05 the tail end of the hammer like bar which is just above the $1.04 support of the belt hold candlestick.
Saturday, March 11, 2006
China Sun

Price movement for the last 2 days was within the high of 66.5 cents and the low of 63 cents for doji bar formed on the 8th March 2006. Both RSI and stochastics are showing signs of weakness. The 63 cents low of the doji maybe tested next week. If it is broken the next support will be 61.5 cents, close to the 50 day exponential moving average support.
Friday, March 10, 2006
Biosensors as requested by Snow

Biosensors testing gap support at $1.09. Major congestion area between $1.09 to 98 cents. Stochastics in oversold region but %K line is below %D indicating price weakness. If gap support at $1.09 fails next support at $1.05 will be tested. See chart below for weekly chart.
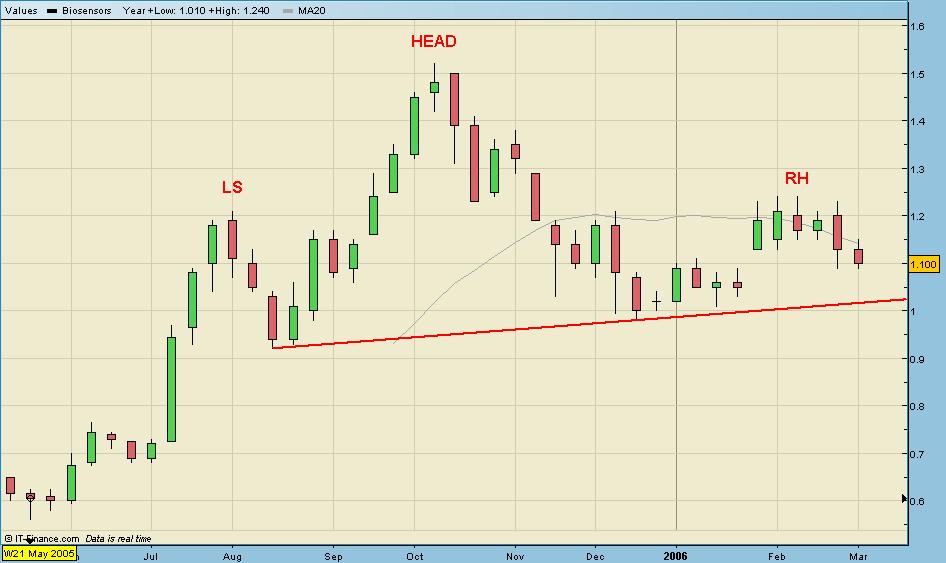
A potential Head and Shoulder pattern is forming on the weekly chart. This formation can only be confirmed if the price breaks down thru the red neckline as shown in the chart.
Both charts are as per time stamped.
Rotary - Trading In New Box Range

Taking reference from previous day high of 51.5 cents and the lows on 7th and 8th March 2006, a new box range 51.5 cents to 49.5 cents has been created. If 49.5 cents support is broken 48.5 cents will be tested. Be nimble. Chart as per time stamped
Thursday, March 09, 2006
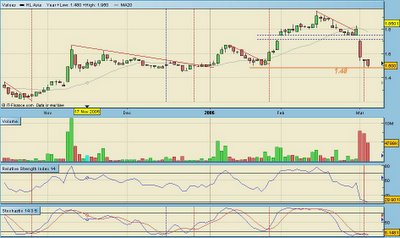
HL Asia - Review

$1.48 hammer tail support broke yesterday. Taking reference from 15th Nov 2005 and 21st Dec 2005 as shown by the dark blue line the new tentative support is $1.45. RSI and stochastics are weak because of strong downtrend pressure. 200 day exponential moving average support is at $1.43. Volume has been declining since 1st March 2006. Still waiting patiently.
Wednesday, March 08, 2006
Bio-Treat as requested by Phantom77

For the last 2 days the $1.20 resistance was pierced during intra day trading but it always closed weak falling back below the $1.20 level. A new pivot resistance level of $1.23 was set yesterday. Immediate support level was raised to a higher pivot point at $1.16 as the price rose. The new box range is $1.23 to $1.16.
UTAC - Review

88.5 cents support was tested. Will price rebounce from 88.5 cents or rebounce from there? Wait for closing price to determine End of Day bar formation. Chart is correct as per time stamped.
UTAC as requested by Prime - Tuesday, March 07, 2006

Taking reference from 2nd February 2006 high 98 cents and 2nd March 2006 high 98.5 cents as shown by the red bold horizontal line AB on the chart, a potential double top maybe forming. Confirmation of this double top will only happen if price drops below 88.5 cents the low of the tiny hammer candlestick formed on 23rd February 2006, shown as point C on the chart.The next few days may see a test of the 91.5 cents to 88.5 cents congestion area. Both RSI and stochastics are showing weakness today. If the 88.5 cents point C support can hold a rebounce towards the point B high of 98.5 cents will occur.
HL Asia as requested by Prime - Tuesday, March 07, 2006

Price will continue to trade within the $1.48 low to $1.55 high range until strong buying or selling move price out of this congestion area. Short term traders will buy at $1.48 and $1.49 and sell at $1.54 and $1.55. No clear indication yet where price will head from this range area.
Rotary as requested by George Lam - Monday, March 06, 2006

For the last 5 days the price movement has been compressed within the range of 53.5 cents to 50 cents set by the bullish belt hold candlestick formed on 24th February 2006. Within this rectangle formation a minor support level has formed at 50.5 cents.Price with continue to trade within this rectangle formation until the bulls or bears take control and make a strong break up or down out of the upper 53.5 cents resistance or the lower 50 cents support.
China Petro as requested by Petrolhunter - Sunday, March 05, 2006
Price broke 53.5 cents the previous peak created on 27th February 2006 and closed at 57 cents. 57 cents was the high of the tiny inverted hammer on 9th February 2006. Taking reference from the low of this inverted hammer the first support level will be 55 cents. The second support level is 53.5 cents. If strong buying continues tomorrow 59 cents will be tested.
Tuesday, March 07, 2006
HL Asia - No Hammer Confirmation - Saturday, March 04, 2006
No hammer confirmation despite the stochastics buy signal alert. The stochastics K% has gone below the D% as $1.48 support was tested again for the 2nd time. Both the upper resistance at $1.55 and the lower support of $1.48 set up by the hammer bar were tested without a clear indication of which direction price will move. 3 days of high volume with huge amount of shares changing hands. Another interesting week ahead for this stock.
![]()