
Sunday, April 30, 2006
Timing the Trade by Tom O'Brien
What will make you money in the stock market? Trading stocks that move the soonest, the furthest and the fastest!
Tom O’Brien’s new book is an excellent demonstration of how a technical trader puts things together. Tom O’Brien’s Timing the Trade isn’t a book on technical theory, it’s a practical how-to trading manual written by an experienced trader . . . can be understood by beginners and appreciated by market veterans.
"Tom O'Brien's trademark enthusiasm and spirit shine through in this solid work. Anyone employing technical analysis -- or wanting to employ it will learn from and enjoy this book, as several solid techniques are spelled out in detail. Not only that, but Tom spends considerable time explaining the "why's" and "how's" of his trading methods -- not just the numbers. Whether novice or experienced, you're sure to improve your trading techniques with this book."
Larry McMillan Author- Options as a Strategic Investment
http://store.yahoo.com/stockcharts/titrtomo.html
China Sun - Support Gap Covered

Support gap at 82.5 cents was filled and closed at 84.5 cents. Both RSI and stochastics are still showing weakness. Immediate support is the support band indicated by the blue dotted lines between 82.5 cents and 81.5 cents. Breakdown below this support band will most probably cause price to drop and try to cover the next support gap at 74.5 cents. Immediate resistance is the resistance band between 89.5 cents and 90.5 cents as shown by the green dotted lines. Next resistance is 96.5 cents. Be alert and nimble.
Saturday, April 29, 2006
Landwind - Stuck inside the triangle

Price still trapped inside the triangle. Need to breakout above 58.5 immediate resistance for chance to challenge next resistance at 61 cents. Both Stochastics and RSI are still falling. Immediate support is 52.5 cents.
Friday, April 28, 2006
For advanced traders only
My final type of short is one that can send shivers up your spine. This is the type that should be labeled, "For advanced traders only!" But, in reality, it's just the exact opposite of buying on a dip in a bull market. Except, the "dip" with a short is a pullback to resistance.
Now, why are these scary? Because in a bear market, snapback rallies are fast, furious, and seemingly, never-ending. You're essentially shorting into the hopes and wishes of millions of shareholders.
So, in order to protect yourself, you have to look for two things. One, volume must be dropping off on the rally back up. Two, you must use some kind of stop in case you're wrong, the trend has changed, and the stock is moving back into bull country.
http://www.thestreet.com/comment/charted/923580.html


Those are the types of shorts I look for, and that you should be familiar with. This doesn't mean, by the way, you ever have to play the short side. But, if you happen to be long a stock that sets up into one of these patterns, know that the odds of your stock going down further have just increased dramatically.
http://www.thestreet.com/comment/charted/923580.html
Specifically for bear markets

Remember, that when stocks are in a downtrend, they rarely go straight down. Instead, they go down a little, then move sideways into congestion, and then go down again. This intermediate congestion is a bit shorter than the type I showed with LifeMinders.com (LFMN:Nasdaq - news), but works almost as well.
http://www.thestreet.com/comment/charted/923580.html
Break from an upward trendline
This is almost identical to the congestion break, but often works better because the violent downside move comes as a complete surprise to those long the stock.
http://www.thestreet.com/comment/charted/923580.html
Standard break from congestion
The first type is my standard break from congestion. Nothing fancy here, just look for a straight, but broken support line, and high volume.
http://www.thestreet.com/comment/charted/923580.html
Landwind

RSI head and shoulder formation and weakening stochastics. Be alert and nimble. Immediate support is the doji tail at 55.5 cents. Immediate resistance is 58.5 cents. Next resistance is the blue dotted line at 61.5 cents.
Thursday, April 27, 2006
Sunpower - Neckline Support Tested

Inverted Head and Shoulders Neckline support at 18.5 cents was tested 4 days ago and is still intact. Yesterday closed with a gravestone doji formation and the current lunch break formation is another doji. These dojis indicate market indecision. Immediate support is 19.5 cents. Next support is the neckline suppport at 18.5 cents. Immediate resistance is 22 cents. Breakout above 22 cents will see price move upwards towards the next resistance zone between 26 cents to 28 cents.
THE FOUR KINDS OF DOJI CANDLESTICKS
In Lesson #4 of my swing trading course (the lesson entitled "Swing Trading By Candlelight"), I showed how certain key candlesticks were able to identify every major trend reversal in the S&P 500 for a period of several months. It is vital for swing trading success, I argued, to recognize candlesticks and assess their implications. Starting with today's "Inside The Black Box" article, we're going to return to candles on a systematic basis.
Candles are vital to swing trading because they identify possible reversals in trend. There are several major reversal candles to discuss, and you can rest assured that I will cover all of them in detail in upcoming issues. This week I want to focus on the doji. I will assume in writing this series that candlestick terminology is fairly fresh in your mind. If it's not, you might want to review our "Swing Trading By Candlelight" trading lesson on our web site.
If you were to ask me which of all the candlesticks is the most important to recognize, I would answer unhesitatingly -- the doji. On a daily chart, the doji often marks the beginning of a minor or intermediate trend reversal. Fail to recognize the doji's implications and you run the risk of buying at the top or staying far too late in a trade and leaving substantial profits on the table.
There are four types of dojis -- common, long-legged, dragonfly and gravestone. All dojis are marked by the fact that prices opened and closed at the same level. If prices close very close to the same level (so that no real body is visible), then that candle is read as a doji.
After a long uptrend, the appearance of a doji can be an ominous warning sign that the trend has peaked or is close to peaking. A doji represents an equilibrium between supply and demand, a tug of war that neither the bulls nor bears are winning. In the case of an uptrend, the bulls have by definition won previous battles since prices have moved higher. Now, the outcome of the latest skirmish is in doubt. Meanwhile, after a long downtrend, the opposite is true. The bears have been victorious in previous battles, forcing prices down. Now the bulls have found courage to buy and the tide may be ready to turn.
A "common" doji has a relatively small trading range. It reflects indecision.
A "long-legged" doji is a far more dramatic candle. It says that prices moved far higher on the day, but then profit taking kicked in. Typically, a very large upper shadow is left. A close below the midpoint of the candle shows a lot of weakness.
When the long-legged doji occurs outside a Bollinger band, my experience says you should be extremely vigilant for the possibility of a reversal. A subsequent sell signal given by an indicator such as stochastics is typically a very reliable warning that a correction will occur.
A "gravestone doji," as the name implies, is probably the most ominous candle of all. On that day, prices rallied, but could not stand the "altitude" they achieved. By the end of the day they came back and closed at the same level.
Finally, a "dragonfly" doji depicts a day on which prices opened at a high, sold off, and then returned to the opening price. In my experience, dragonflies are fairly unusual. When they do occur, however, they often resolve bullishly (provided the stock is not already overbought as shown by Bollinger bands and indicators such as stochastics).
When assessing a doji, always take careful notice of where the doji occurs. If the security you're examining is still in the early stages of an uptrend or downtrend, then it is unlikely that the doji will mark a top. If you notice a short-term bullish moving average crossover, such as the four-day moving average heading above the nine-day, then it is likely that the doji marks a pause, and not a peak. Similarly, if the doji occurs in the middle of a Bollinger band, then it is likely to signify a pause rather than a reversal of the trend.
As significant as the doji is, one should not take action on the doji alone. Always wait for the next candlestick to take trading action. That does not necessarily mean, however, that you need to wait the entire next day. A large gap down after a doji that climaxed a sustained uptrend should normally provide a safe shorting opportunity. The best entry time for a short trade would be early in the day after the doji.
Dojis should not be assessed mechanically. However, after a strong trend in either direction they often mark major turning points. Always recognize the doji when it occurs, and be prepared the next trading day to take appropriate action.
http://www.streetauthority.com/terms/doji.asp
Dragonfly Doji
The Dragonfly is a type of doji that forms with its open, close and high at the same level. It is a candlestick that emits bullish properties and can be significant when found at that the bottom of a downtrend, especially if this is near a level of support.
The Dragonfly should have a long lower shadow, which indicates that the market moved significantly lower during the session, however the bulls exerted enough buying pressure to force the price back up to the opening level.
The Dragonfly is closely related to the Hammer which is also found at the bottom of a downtrend and can signify the start of a reversal.
http://www.trade2win.com/traderpedia/Dragonfly_Doji
Gravestone Doji
The Gravestone is most effective when it appears at the top of an uptrend. It is the bearish counterpart of the Dragonfly Doji. The Gravestone doji's open, close and low are all at the same level at the bottom of the candle.
The Gravestone doji indicates that whilst there may have been some upward movement, the bears were strong and pushed the price right back down to the opening level. If you see the Gravestone doji at the top of an uptrend in which you are long, then take the profits quickly before the price reversal takes hold and is confirmed with a solid bearish candle to follow.
Retrieved from "http://www.trade2win.com/traderpedia/Gravestone_doji"
Doji
A candlestick with a body so small that the open and close prices are equal.
With a doji there is no (or a very small) real body as it is formed because the buyers could not exert enough bullish pressure to push the price higher than the open, and the sellers could not exert enough bearish pressure to make the price go lower than the open. In essence the doji represents indecision.
Doji come in several varieties as well, there is the standard doji - metioned here, as well as the Gravestone and the Dragonfly Doji, both of which have their individual characteristics.
The doji is often represented as a sign of a turning market. While it is common to see a doji at a market top or bottom, it is not wise to use it alone as a turning signal. Indecision means exactly that, the market is unsure of its future direction - therefore it should only be used as a warning, not a stand-alone signal. If the doji appears at previous support or resistance it is more likely to signal a potential reversal, however it occasionally appears out of the blue, and this should signal caution to the trader - but positions should not be liquidated without further confirmation. A common way to use this signal in an uptrend would be to use a close under the low of the doji to signal a top, and a close above the high of the doji to signal continuation, with the reverse for a downtrend.
Retrieved from "http://www.trade2win.com/traderpedia/Doji"
DOJI
If a security has virtually equal opening and closing prices, this leads to a Doji. The length of the upper and lower shadows of a Doji can vary and consequently the resulting candlestick may look like a cross, inverted cross or a plus sign. Doji, taken alone, is a neutral pattern.
Recognition Criteria:
1. The real body is either a horizontal line or it is significantly small (its length is not more than a few ticks).
2. The upper and lower shadows vary in length.
Explanation:
The open and close should be equal in an ideal Doji. However the real life is unfortunately not that simple. A Doji with an equal open and close may be considered more robust but it is also rare in the real life. Hence it is more important to capture and understand the essence of this important candlestick. Doji is a particular signal showing indecision about the direction of the market and it represents a tug of war between buyers and sellers. Doji simply shows that prices has moved above and below the opening price during the day, but then the security closed either exactly at or very near the opening price. The overall result is a standoff. It shows that neither the bulls nor the bears were able to gain control during the day and it is possible that a turning point can develop soon.
Important Factors:
Doji is an important candlestick. It provides information on its own. It also features in other formations as an important element.
Doji is relatively easy to spot. It has a very small body with the appearance of a thin horizontal line. The very small body relative to other candlesticks is its distinguishing characteristic.
Doji needs to be interpreted in terms of a preceding trend or preceding candlesticks. The appearance of a Doji after an advance or a long white candlestick signals the fact that the buying pressure is getting weaker. The appearance of a Doji after a decline or a long black candlestick signals the fact that the selling pressure is diminishing. Essentially Doji gives the message that the forces of supply and demand are becoming more evenly matched and consequently a change in trend may be near. However Doji alone is not enough to identify a reversal and further confirmation by following signals may be warranted.
The importance of Doji as a signal is somewhat relative and depends on the characteristics of the market. It is actually important only in markets where you do not see many Doji. If there are many Doji on a particular chart, the appearance of a new Doji in that particular market is not very meaningful and its signal value is negligible.
http://www.candlesticker.com/Cs07.asp
Doji
A Doji is a name of a candlestick in Japanese Candlestick charting. This type of charts allow for a quick visual digestion of changing supply and demand patterns. The Doji is one of many types of patterns or candlesticks that give implication as to future price action. The Doji is simply a formation in which the open and close are the same. This candlestick is a component of many important candlestick patterns such as the Doji Star which is a Doji which gaps above or below a white or black candlestick. The Doji star is a reversal signal with confirmation to be made during the next trading period.
Japanese's Candlesticks allow for a quick digestion of supply and demand but some of the interpretations of candlestick formations should be supported with a wide body of other information before trading. Most of the Japanese Candlestick patterns are psychologically based interpretations. A type of trading atmosphere that often creates a particular formation of candlesticks or an individual candlestick is the result of a struggle between supply and demand elements and does reoccur but often cannot be used with a high confidence in predicting future price action.
http://www.trade10.com/Doji.html
Doji
A name for candlesticks that provide information on their own and also feature in a number of important patterns. Dojis form when a security's open and close are virtually equal.
A doji candlestick looks like a cross, inverted cross, or plus sign. Alone, doji are neutral patterns.
http://www.investopedia.com/terms/d/doji.asp
A doji candlestick looks like a cross, inverted cross, or plus sign. Alone, doji are neutral patterns.
http://www.investopedia.com/terms/d/doji.asp
Wednesday, April 26, 2006
Triple Top
A triple top is considered to be a variation of the head and shoulders top. Often the only thing that differentiates a triple top from a head and shoulders top is the fact that the three peaks that make up the triple top are more or less at the same level. The head and shoulders top displays a higher peak - the "head" - between the two shoulders.
According to experts including Murphy, making a distinction between these two patterns is largely academic because they both imply the same thing.1 They are both "reversal" patterns of an upward trend in a stock. The triple top marks an uptrend in the process of becoming a downtrend.
http://www.recognia.com/reference/patterndescr_tt.htm
Triple Top (Reversal)
The triple top is a reversal pattern made up of three equal highs followed by a break below support. In contrast to the triple bottom, triple tops usually form over a shorter time frame and typically range from 3 to 6 months. Generally speaking, bottoms take longer to form than tops.
Throughout the development of the triple top, it can start to resemble a number of patterns. Before the third high forms, the pattern may look like a double top. Three equal highs can also be found in an ascending triangle or rectangle. Of these patterns mentioned, only the ascending triangle has bullish overtones; the others are neutral until a break occurs. In this same vein, the triple top should also be treated as a neutral pattern until a breakout occurs. The inability to break above resistance is bearish, but the bears have not won the battle until support is broken. Volume on the last decline off resistance can sometimes yield a clue. If there is a sharp increase in volume and momentum, then the chances of a support break increase.
http://www.stockcharts.com/education/ChartAnalysis/tripleTop.html
Tuesday, April 25, 2006
New Concepts in Technical Trading Systems
This classic book published in 1978, is the original source for six technical trading systems from Welles Wilder. Writing this book established Wilder's reputation as a respected technican. In more recent years, he has become better known for his promotion of the Delta Society, the Delta Phenomenon, and the Adam Theory.
The main theme and message of the book is that a good technical trading plan consists of three elements: 1. Use of a good technical system 2. Use of this system on the right market(s) at the right time, and 3. Use of a good money management techniques.
Wilder advises that of these the third is the most important, the easiest to learn and the hardest to do.
Wilder's treatement of money management is very brief and concise. It is summed up by two criteria: Don't margin over 15% of total capital on one commodity, or over 60% of total capital at one time. The balance is the emphasis on the the difficulty of recouping trade losses, and how the percent gain required to recoup a loss increases geometrically with the loss.
Development of technical systems and a method of selecting the right markets are the primary topics of the book. Wilder advises that he has never seen a technical system which CONSISTENTLY makes profits in all markets. Trend-following systems typically make consistent profits in DIRECTIONAL markets, but sustain consistent losses in NON-DIRECTIONAL markets. Since markets are typically non-directional 70+% of the time, and directional 30-% of the time (Wilder's figures), the answer to consistently profitable trading would appear to discover a way to define directional movement and translate this definition to a rating scale within known perameters. The most important contribution of the book (in both Wilder's opinion and my own) is its development of the Directional Movement Index, which is (his) answer to this problem. Other important contributions are the development of Parabolics and RSI (Relative Strength Index). All three are still widely use today, and are standard inclusions in most stock and futures analytical software packages. The other systems in the book are not well known, and are of lesser import.
http://store.yahoo.com/stockcharts/newcointean.html
Relative Strength Index (RSI)
Developed by J. Welles Wilder and introduced in his 1978 book, New Concepts in Technical Trading Systems, the Relative Strength Index (RSI) is an extremely useful and popular momentum oscillator. The RSI compares the magnitude of a stock's recent gains to the magnitude of its recent losses and turns that information into a number that ranges from 0 to 100. It takes a single parameter, the number of time periods to use in the calculation. In his book, Wilder recommends using 14 periods.
The RSI's full name is actually rather unfortunate as it is easily confused with other forms of Relative Strength analysis such as John Murphy's "Relative Strength" charts and IBD's "Relative Strength" rankings. Most other kinds of "Relative Strength" stuff involve using more than one stock in the calculation. Like most true indicators, the RSI only needs one stock to be computed. In order to avoid confusion, many people avoid using the RSI's full name and just call it "the RSI."
http://stockcharts.com/education/IndicatorAnalysis/indic_RSI.html
Monday, April 24, 2006
Landwind - RSI Head and Shoulder formation

RSI Head and Shoulders seen on current live chart. Be alert and nimble. Stochastics hovering in oversold region. Immediate support is 58.5 cents. Next support is 57.5 cents. Critical support at 54 cents. Immediate resistance is 61 cents. Breakout above 61 cents will see retest of 64 cents.
New Traders
You are here because you read or heard about someone who has “made a killing” in the market. Or you have been lured to the stock market by the promise of easy money or quick bucks. Maybe you hate your job and want to trade from home for a few hours in the morning and spend the rest of the day sitting on the beach or some other fantasy.
If that’s why you are here, you are at the wrong place. Just drop me line and I will send you a list of web sites that promise quick fortunes. Quick large profits happen as often as winning a state lottery. It can happen…it just usually happens to someone else. And lotteries can’t be relied upon to bring in a monthly income.
Ask yourself – How good a trader are you? How’s this for a statistic. Over 70% of people trading less than 1 year consider themselves good traders. However, 95% of those same traders were losing money. And over 90% within 1 year of starting to trade will quit trading out of disgust or loss of money or both.
Too many traders enter the market without the proper tools. They fail to use the appropriate systems and methods to trade. The market no longer need be the domain of the professional trader. Traders who have the time, capital, persistence, motivation, knowledge and methodology will succeed. We are going to give you the techniques and systems that the professional use.
http://www.arbtrading.com/newtraders.htm
SharpShooter Trading System
What would you pay to be able to accurately identify and profit from market tops and bottoms? That kind of knowledge could be costly if it was available at all...except that it IS available and it ISN'T Costly!In fact, SharpShooter just might be the best value ever for stock and commodity traders.
SharpShooter seeks turning points in the market rather than following established trends between turns. The system is designed specifically to go short at market tops and long at market bottoms.
SharpShooter’s signals are simple. When the system identifies a probable approaching market top, it displays a short sell price on-screen with audible and visual alerts. When it identifies a probable approaching market bottom, SharpShooter generates a specific long entry signal.
Because of its remarkably effective exit strategy, based on current floor pivots and other historical data, SharpShooter can capture substantial portions of moves after the market tops or bottoms out.
Does SharpShooter work on every stock or futures contract? Of course not, but it can be expected to be highly successful on the vast majority of securities. We personally prefer to trade indexes instead of individual stocks - the reasons are outlined below.
http://www.commandotrader.com/SharpShooter.htm
Ablesys: Award-winning high-performance trading system software
eASCTrend is a professional decision making program that is universal to any markets and any time charts including Stock, E-mini, Forex and Futures markets. It can be used for any trading styles: Day Trading, Swing/Position Trading, Portfolio/Position Trading, Auto Order Execution (AOE). AbleSys has successfully provided traders with powerful buy/sell signals and dynamic risk-control stops since 1994!
eASCTrend offers highly accurate, reliable Back-testing. Ablesys Back-testing technology lets you tradethe upcoming market with the back-test proven winning strategies. Back-testing is a must! It is the only way to prove that your trading strategies are sound and effective. Back-testing manages your risks so you are not just shooting in the dark with unproven strategies, no matter how many bells & whistles they might have.
The AbleSys Psychological Advantage: Statistically, less than 3% of traders will win in trading. However,the common secret among successful traders is unemotional "discipline". Most traders are psychologically vulnerable during trading because of the fear or greed. Mentally, many traders are paralyzed by the real-time uncertainty of the position profit and loss. Making sound trading decisions for those traders become next to impossible under this circumstance. eASCTrend helps traders to make peace with themselves and make peace with the markets by offering timely, objective, specific, validated and actionable trading signals for each and every stage of a trade. The ultimate goal of a disciplined and successful trader is to remove confusion, information overload, guesswork, and emotion in trading.
Look around our site. View our informational slideshows and see what other traders have to say. If you are serious about trading and joining elite group of successful traders, order 30-day trial and see how the system works. After using eASCTrend, you will never see the markets the same way again.
http://www.wintick.com/6_0/home.asp?ISC=google
The Ingenious, Simple 3-Step Strategy
The Ingenious, Simple 3-Step Strategy
Of A Stock Trader Who Makes Up To
$3,350/Day Trading Nasdaq-100 Stocks
Your Personal Invitation To Discover, And Witness Without Risk, The Precise Tools Our Traders Are Using To Consistently Generate Over $200/Day Trading From Home.
Learn the simple, straightforward 3-step technique we teach on the next page. Simply watch and learn without taking any risk. See how, with a little know-how and the right trading-tools, you too can build regular daily profits, spending no more than 10 mins/day [or evening] in front of your PC.
Dear Fellow Trader,
Imagine a simple chart-setup which shows up on May 17th 2005, just one day before a major move in 'XM Satellite Radio' [an active stock listed on the Nasdaq-100]. You take your position and ride the precision-signaled 10-day swing in this stock - a market advance, which would have allowed you to capture this powerful wave, locking into a net options profit of $14,592.40 in just 10 trading days [total capital input on this trade: $1,910]...
http://www.insight.net/
Sunday, April 23, 2006
5 Trading Tools Not Available in Other Forex Trading Platforms
1) Volume Profile Charts - Advanced Charting that shows you the Open / High / Low / Close but more importantly where all the trading activity takes place. This shows you REAL support and resistance areas to buy and short and exit trades. Why do so many traders lose money trading? Human emotion! Here's what often happens. Many traders enter positions in a certain direction, they are wrong and it goes against them. They sit and wait and sweat as they are losing money, sometimes a LOT of money. Many exit with losses. Others hold on tight and hope the market reverses. When it often does and comes back to the area they placed their trades they are so relieved to get out with a small loss or breakeven they almost always exit. This causes the market to stall at this level at the least and usually reverse. These areas are often the lowest risk and highest probability trades! Without Volume Profile charts you are really trading blind.
http://www.topgunsoftware.com/forextrading.html
http://www.topgunsoftware.com/forextrading.html
There are Three Main Ways for Successfully Trading the Futures
Method 1) Trend Following - Trading With the Trend, Anticipating Trend Direction and Using Retracements / Entering on Pullbacks.Method
2) Range Trading - Many days the market has no clear trend, learn how to trade and when to buy and sell on these days.Method
3) Trend Reversal - Using Volatility, Major Areas of Support & Resistance, and Trend Reversal
Tool to Anticipate Reversals
Method 1) Trend Following - How to Know in Advance Which Way the Market is MOST Likely to Trade
Breakthrough Concept - Use the Stocks that Makeup the Futures/Sectors to PREDICT Market Direction in ADVANCE!
One of the most useful tools in TopGun Software for Futures and Stock Traders is the Balance Point Sectors group of tools. We have this tool for all the major Indexes (S&P, NASDAQ, Dow, and Russell) as well as the major Sectors (Semiconductors, Technology, Biotechnology, Drugs, Banks, Retail, Oil, Housing).
Here's how it works:
Every stock has a higher probability (of various degree) of going up or down. Without revealing our secret formula, and it is very complex due to analyzing every trade in every stock throughout the day, we show you if each sector and index is more likely to go up or down. We calculate each indexes and sectors balance level and our tool shows how far they are above or below balance.
Easy to interpret, these set of tools will let you know when to buy, when to sell, and just as importantly when the market is likely to be choppy and directionless. Knowing when not to trade or to trade more cautiously gives you an incredible edge over other traders who trade the same way day in and day out. And as you will see, these tools are one of the few leading indicators in existence and frequently predict futures movements 3 to 15 minutes before they occur!
Here's How to Immediately Profit from Knowing ahead of time which way the market will go.
Rule 1) Look to BUY when 3 out of the 5 sectors are Above their Balance Points.
Rule 2) Look to SELL when 3 out of the 5 sectors are Below their Balance Points.
Rule 3) If 4 or 5 out of 5 sectors are Above their Balance Points a nice up trend should develop.
Rule 4) If 4 or 5 out of 5 sectors are Below their Balance Points a nice down trend should develop.
Rule 5) On gap days this tool is absolutely essential for knowing whether to "Fade the gap" or Trade in the Gap's Direction.
http://www.topgunsoftware.com/futurestrading.html
Three Steps for consistently making money trading stocks
Step One) Determine which way the market will move and trade stocks in that same direction.
This will reduce your risk and give you a higher percentage of winning trades and reduce the loss on your losing trades. Most stocks follow the market. On up days most stocks have far less selling and more buying which causes them to go up. The reverse goes on down days. Our software has many tools for helping you gauge market direction.
Rules of Thumb
Rule 1) If above the pivot go long, if below go short. (Pivot point is horizontal white line).
Rule 2) If above the balance point line go long, if below go short. (Balance Point Line is yellow line and where market's average position is).
Example:
In the example below you can see the S&P 500 futures. This is one of the best overall market indexes and most stocks tend to follow its direction. In this example we have a few of our predictive tools - Balance Point Sectors, Pivot Points, Statistical Range, Squat Bar and Trend Reversal indicators.
First look at the pivot points, the white line is the average price of the previous day and the rule of thumb is to buy if the market is above and look for shorts below. The next step is to look at our Balance Point Line which is the average price that traders hold positions. This is one of the most useful tools and is a fantastic support/resistance level. If above the yellow line you should be long and below the yellow line short. If above the pivot point and balance point line your odds of success buying are dramatically increased. During times where the market is under the balance point and above the pivot use caution buying. Reverse for shorts.
Let's see how the above and our other tools worked in the chart below. The market was above the pivot all day and on three occasions pulled back to it and reversed. There were low risk stock buying opportunities at 9:45 am, 10:45 am, and 1:15 pm EST when the market pulled back and found support at the Pivot. This happens usually at least once each day and is a source of the lowest risk trades. Buy stocks when the market finds support at the pivot. If the market is below the pivot and rallys up to the pivot short stocks when the market finds resistance there. Using these TRADING ZONES can dramatically improve your trading results and end the confusion about which direction to trade.
http://www.topgunsoftware.com/stocktrading.html
Saturday, April 22, 2006
Tools and Tactics for the Master Trader
A Japanese proverb says, “If you wish to know the road, inquire of those who have traveled it.” The authors of Tools and Tactics for the Master Trader clearly know the road. Their unique insights, trading tactics and powerful tools, so enjoyably presented, make this a book that belongs on every trader’s shelf.
Steve Nison, CMT - Author of Japanese Candlestick Charting Techniques
Tools & Tactics for the Master Day Trader is designed to help active self-directed traders gain the knowledge and acquire the tools necessary to approach the markets with intelligence and a well thought out trading plan. This no-nonsense, easy read is meant to be referenced by traders every trading day and covers everything from battle-tested trading strategies to intuitive insights on psychology and discipline. Proving once again that the best teacher is experience, Tools and Tactics for the Master Day Trader will help any trader with the technical skills, market knowledge, and confidence needed to increase the odds of achieving more winning trades and capturing profits.
http://www.pristine.com/book.htm
Guerrilla Trading Tactics: Tools for Today’s Active & Short-Term Investors
Even veteran market professionals admit that today's investment arena is more confusing than ever before. Market trends, if they develop at all, tend to be short-lived, and fundamental valuations are frequently invalid. So what can you do to succeed in such a chaotic financial environment?
Adopt a “guerrilla” style of trading. Forget long-term thinking. Abandon buy-and-hold strategies. Instead, hit the market with quick, profit-grabbing attacks. Relying on time-tested technical trading patterns for entry and exit cues, Oliver Velez shows how to raid the markets for consistent short-term profits using “guerilla” tactics that boast historic success rates of 80% or more - and now he shares these winning market moves with you.
Don't keep making the same old mistakes with the same old techniques. Join Oliver Velez today and learn ...
o How to handle a market without a recognizable trend.
o 13 best tactics in the guerrilla trader's arsenal.
o 2 key strategy approaches: trading to build wealth or trading for income.
o Special tactics for playing excess volatility - and for stable markets.
o Micro trading, the elements of swing trading, candlestick charts, bullish and bearish chart patterns - and more!
http://www.invest-store.com/pristine/coretrading/
Core Trading Tactics with Oliver Velez
Core trading is - monitoring weekly charts – instead of daily or intra-day charts. Core Traders can hold positions for weeks or months, thereby grabbing even larger profits. It’s a great hedging tool – and the perfect strategy for updating longer-term portions of your portfolio like IRAs and 401(k)s.
This first-of-its kind, comprehensive workshop covers …
How Core Trading differs from investing – and tools needed to be a successful Core Trader
Using weekly charts to profit from major moves
Specific guidelines to precisely time entries and exits
Counting your way to profits, using red & green Candlestick bars
How to find the Pristine Buy & Sell Zones – and much more.
http://www.invest-store.com/pristine/coretrading/
Swing Trading With Oliver Velez
Here’s one of the very first video presentations on Swing Trading available today. Pristine.com's founder, Oliver Velez, packed the halls at the recent International Online Trading Expo and set new attendance records with over 800 individuals attending his 90 minute tutorial session on "Swing Trading". Now, you can view this incredible presentation, accompanied by an online companion manual, giving you all the information on taking swing trading to new levels of trading success.
With this video, you will find the proprietary techniques the Pristine staff have refined over the years-presented in the most easy to understand way. These concepts form the corner stone of every sound trading strategy and, once mastered, traders will rarely find themselves on the wrong side of the markets.
Viewers will find:
An introduction to swing trading basics and benefits
How to spot opportunities using successful swing trading criteria
Key set-ups and using moving averages
Reading charts successfully-especially Japanese Candle Sticks
http://www.pristine.com/newvideo.htm
Friday, April 21, 2006
Analysis of the head and shoulders bottom
Analysis of the head and shoulders bottom should focus on correct identification of neckline resistance and volume patterns. These are two of the most important aspects to a successful read, and by extension a successful trade. The neckline resistance breakout combined with an increase in volume indicates an increase in demand at higher prices. Buyers are exerting greater force and the price is being affected.
Traders do not always have to chase a stock after the neckline breakout. Many times, but certainly not always, the price will return to this new support level and offer a second chance to buy. Measuring the expected length of the advance after the breakout can be helpful, but don't count on it for your ultimate target. As the pattern unfolds over time, other aspects of the technical picture are likely to take precedent. Technical analysis is dynamic, and your analysis should incorporate aspects of the long, medium and short term picture.
http://stockcharts.com/education/ChartAnalysis/headShouldersBottom.html
Head and Shoulders Bottom - Inverted Head and Shoulders
Breakout Expectation: A head and shoulders bottom is confirmed with the upside penetration of the neckline. To determine an upside price objective from the confirmation level, add the distance from the low of the head to the neckline. This is called a measured move. Because these patterns are known to mark important and lasting lows, the upside move which follows may exceed the distance from the head to the neckline and be met with additional buying and momentum.
http://www.thestockbandit.com/Head-shoulders-bottom.htm
http://www.thestockbandit.com/Head-shoulders-bottom.htm
Sunpower - Inverted Head and Shoulders Formation Confirmed

Closing price for 2 consecutive days above the red neckline at 18.5 cents confirmed the inverted head and shoulders formation. Immediate support is the purple dotted line at 19.5 cents. Critical neckline support at 18.5 cents. Immediate resistance is 22 cents as shown by the green line. Both RSI and stochastics are in oversold region. Some profit taking before resuming uptrend climb. Theoretical target price is 27 cents. Be alert and nimble.
Thursday, April 20, 2006
A Beginner's Guide to Short-Term Trading
Synopsis:
Toni Turner does it again! This bestselling author and trading coach, delivers another strategy-packed guide for short-term trading. Ideal for anyone new to the game - and those looking for ways to boost their short-term trading profits - it's compact, to-the-point and filled with-need-to-know facts. Destined to be another #1 bestseller, see why pros are saying “With today's current market, you can't afford to miss this book!" Now at a great price.
Jacket Description:
Tired of playing the waiting game with the same stocks year after year? Savvy trader Toni Turner Shows you ins and outs and the ups and downs of short-term trading. She'll have you buying and selling on a monthly, weekly, or even daily basis so that you have the right stocks at the right time. Ms. Turner's clear advice, easy-to-follow explanations, and helpful charts can get you started right away in the highly profitable world of short-term trading.
Review:
Book Review by Jaye Abbate, Traders' Library
The short term markets are hotter than ever. Even buy-and-holders are devoting a portion of their trading dollars to investments that hold the promise of quick rewards. Now - two new books by two trading veterans provide powerful strategies for realizing shorter-term gains.
The Beginner's Guide to Short-Term Trading by the popular Toni Turner, is a guide by a real trader, with real-world experience. Toni can make the complex completely accessible in a few simple paragraphs. She covers the core principles and basic strategies associated with short-term trading and includes everything from which charting techniques are most useful, short-selling methods, proper money management for fast-paced markets, and page after page packed with proven strategies. A great complement to her "Beginner's Guide to Short-Selling" video," this new bestseller is a thorough, well-rounded guide that combines theoretical, practical and proven nuances that can get even novice investors trading on a monthly, weekly or even daily basis in no time.
The short term markets are hotter than ever. Even buy-and-holders are devoting a portion of their trading dollars to investments that hold the promise of quick rewards. Now - two new books by two trading veterans provide powerful strategies for realizing shorter-term gains.
Sniper Trading by trading pro George Angell another book his long-time followers have been waiting for. Angell finally reveals his distinct 3-point method for: Recognizing vital market patterns that signal profitable opportunities, seizing them, and then exiting the market in a fast break. In essence - "sniper" trading.
Angell first describes how to "measure, quantify and interpret market data so you can quickly figure out when the market will move - and which way it will go." Then, he introduces his own signature trading system - the LSS - which has gained fame as a top breakout system for short-term traders. Three critical factors - support and resistance, time and price, and day of the week - form the backbone of his totally unique and winning system, and he explains how he uses each in precise detail.
Angel devotes an entire section to all the factors unique to the short-term markets. Plus, insights on how to stay focused, keep fear and greed in check, and develop an intuition about the market. Readers discover how to recognize market patterns, master the discipline to apply this knowledge, and come out a winner. Whether you invest in stocks, options or futures - Angell's proven methods have been working in the short-term markets for years -well before short-term trading became so popular. Now, these same skills are survival tools for today's traders, and an experienced trader like George Angell helps every reader become a short-term trading "Survivor."
Armed with these two new titles, every trader can become closer to attaining mastery of the short-term trading market.
http://www.traderslibrary.com/moreinfo.asp?item=41613&SID=BRXZAXBGJPZ42DEA15565735398D8DDC&lc=QuickSearch&page=Search+Page+%2D+Traders%27+Library&refer=search%2Easp%3FSID%3DBRXZAXBGJPZ42DEA15565735398D8DDC%26pagename%3DSearch+Page+%2D+Traders%27+Library%26page%3D1%26file%3DFalse%26searchType%3D10%26keywords%3DTONI+TURNER%26sort%3D%26lc%3DQuickSearch%26submit%3Dyes%2341613
Head and Shoulders Bottom
Introduction
Like the head and shoulders top, the head and shoulders bottom is a popular pattern with investors. The reverse of the head and shoulders top, the bottom marks a reversal in a downward trend in a stock's price -...
In fact, Elaine Yager, Director of Technical Analysis at Investec Ernst and Company in New York and a member of Recognia's Board of Advisors, holds that this pattern most commonly occurs during the reversal of a major trend, a trend that has been in existence for a year or more.
While volume is important to a head and shoulders top, it is absolutely crucial to a head and shoulders bottom. An investor will be looking for increasing volumes at the point of breakout. This increased volume definitively marks the end of the pattern and the reversal of a downward trend in the price of a stock.
http://www.recognia.com/reference/patterndescr_hsb.htm
Wednesday, April 19, 2006
How to confirm and trade inverted head and shoulders formation
According to Bulkowski, "if you can determine that a head and shoulders formation is completing, consider buying the stock. The formation rarely disappoints and the rise is worth betting on."11 He does continue, however, to caution potential investors to first be sure that what they are looking at is a true head and shoulders bottom. If you're unsure, he advises, wait for the breakout at the neckline.
Schabacker advises patience when monitoring the development of this pattern. He bases this on the fact that a head and shoulders bottom tends to take longer to form and is smaller in size to a head and shoulders top. Don't expect the time frames for pattern development to mimic that of the head and shoulders top.12 Murphy suggests the investor use this difference to his or her advantage. Because of the smaller price ranges and slower development time, "it is usually easier and less costly to identify and trade bottoms than to catch market tops."13 Although, he concludes, because prices tend to decline faster than they go up, an investor can reap greater rewards trading a head and shoulders top. This greater reward is accompanied by greater risk.
Murphy is adamant that increasing volume is a critical confirming pattern in the completion of a head and shoulders bottom. "If the volume pattern does not show a significant increase during the upside price breakout, the entire pattern should be questioned." 14
Bulkowski advises investors that if they miss the upside breakout, they should wait and watch. They may not have lost a trading opportunity. "Half the time, the stock will throw back to the neckline. Once it does, buy the stock or add to your position." 15
Edwards and Magee call a close above the neckline break of approximately 3% of the stock's market price the "breakout" or "confirmation" of the head and shoulders bottom.16
http://www.recognia.com/reference/patterndescr_hsb.htm
Tuesday, April 18, 2006
Head and Shoulders Bottom (Reversal)
The head and shoulders bottom is sometimes referred to as an inverse head and shoulders. The pattern shares many common characteristics with its comparable partner, but relies more on volume patterns for confirmation.
As a major reversal pattern, the head and shoulders bottom forms after a downtrend, and its completion marks a change in trend. The pattern contains three successive troughs with the middle trough (head) being the deepest and the two outside troughs (shoulders) being shallower. Ideally, the two shoulders would be equal in height and width. The reaction highs in the middle of the pattern can be connected to form resistance, or a neckline.
The price action forming both head and shoulders top and head and shoulders bottom patterns remains roughly the same, but reversed. The role of volume marks the biggest difference between the two. Generally speaking, volume plays a larger role in bottom formations than top formations. While an increase in volume on the neckline breakout for a head and shoulders top is welcomed, it is absolutely required for a bottom. We will look at each part of the pattern individually, keeping volume in mind, and then put the parts together with some examples
http://stockcharts.com/education/ChartAnalysis/headShouldersBottom.html
Sunpower - Potential Inverted Head and Shoulders Formation

Potential Inverted Head and Shoulders Formation developing. Immediate support is the gap support at 15 cents. Immediate resistance is 18 cents. Neckline resistance is 18.5 cents for today. Breakout above neckline theoretical target price is 26 cents. Need to breakout above 18.5 cents for inverted head and shoulders confirmation.
Monday, April 17, 2006
What does an ascending triangle look like?
Converging trendlines of support and resistance give all three patterns their distinctive shape. This occurs, Kahn explains, because "the trading action gets tighter and tighter until the market breaks out with great force."2 Buyers and sellers find themselves in a period where they are not sure where the market is headed. Their uncertainty is marked by their actions of buying and selling sooner, making the pattern look like an increasingly tight coil moving across the chart.
As the range between the peaks and troughs marking the progression of price narrows, the trendlines meet at the "apex," located at the right of the chart. The "base" of the triangle is the vertical line at the left of the chart which measures the vertical height of the pattern.
An ascending triangle - the "flat-top" triangle - also shows two converging trendlines. In this case, however, the lower trendline is rising and the upper trendline is horizontal. This pattern occurs because the lows are moving increasingly higher but the highs are maintaining a constant price level.
http://www.recognia.com/reference/patterndescr_at.htm
Ascending triangles
The ascending triangle is a variation of the symmetrical triangle. Ascending triangles are generally considered bullish and are most reliable when found in an uptrend. The top part of the triangle appears flat, while the bottom part of the triangle has an upward slant. In ascending triangles, the market becomes overbought and prices are turned back. Buying then re-enters the market and prices soon reach their old highs, where they are once again turned back. Buying then resurfaces, although at a higher level than before. Prices eventually break through the old highs and are propelled even higher as new buying comes in. (As in the case of the symmetrical triangle, the breakout is generally accompanied by a marked increase in volume.)
http://www.chartpatterns.com/ascendingtriangles.htm
http://www.chartpatterns.com/ascendingtriangles.htm
Double Top/Bottom
When price peaks after a rise, and the decline that follows leads to another rise in prices to form a second peak at or about the level of the first peak, a double peak is said to have formed. A neckline can be drawn across the base of the two peaks. A neckline is simply a trendline and penetration through a neckline after a decline from the second peak is a good indication that the price of the tradable will continue to fall. Traders often allow for a 5% penetration through a neckline to avoid whipsaws. Volume is generally greater in generating the first top than in making the second.
A double top is simply two peaks. After the second peak is formed a breakout through the base is a signal of a possible reversal of the trend in prices. In the case of a double bottom, two troughs form and an expectation follows for the possibility of a trend reversal if the market price rises through the base.
Waiting for confirmation is important for trading double tops. Twin peak formations usually show a decline of between 10% and 20% between the peaks. Volume is usually higher on the left peak than on the right peak. The confirmation point is the base of the peaks. A breakout through the baseline is more convincing if accompanied by higher volume and predicts a continuation of the trend in that direction. Price projections can be made by determining the price difference from the neckline to the first peak and then subtracting that value from the price at the time of penetration from the neckline.
Price projections are estimates of the potential near term movement of the price once a breakout has occurred. When the price of the tradable is low, the best approach in making price projections is to use percentages. A percentage difference of 6% between the price at the first peak and neckline would translate into a projected price drop upon penetration of the neckline of about 6% of the price at penetration.
http://www.trade10.com/Double_Top.html
Sunday, April 16, 2006
Head and Shoulders Bottom (Reversal)
The head and shoulders bottom is sometimes referred to as an inverse head and shoulders. The pattern shares many common characteristics with its comparable partner, but relies more on volume patterns for confirmation.
As a major reversal pattern, the head and shoulders bottom forms after a downtrend, and its completion marks a change in trend. The pattern contains three successive troughs with the middle trough (head) being the deepest and the two outside troughs (shoulders) being shallower. Ideally, the two shoulders would be equal in height and width. The reaction highs in the middle of the pattern can be connected to form resistance, or a neckline.
The price action forming both head and shoulders top and head and shoulders bottom patterns remains roughly the same, but reversed. The role of volume marks the biggest difference between the two. Generally speaking, volume plays a larger role in bottom formations than top formations. While an increase in volume on the neckline breakout for a head and shoulders top is welcomed, it is absolutely required for a bottom. We will look at each part of the pattern individually, keeping volume in mind, and then put the parts together with some examples.
http://www.stockcharts.com/education/ChartAnalysis/headShouldersBottom.html
Meghmani

Twice recently in February 2006 and March 2006 price exploded upwards when stochastics was in the oversold region. Now it is April 2006 and once again stochastics is in the oversold region. Immediate resistance is the support band at 34.5 to 34 cents. Next support is the green line at 33 cents. Immediate resistance is 35.5 cents. Next resistance is the resistance band between 36 to 36.5 cents.Will history repeats itself the third time?
TraderTalk Technical Tutorial Head and Shoulder Formations
These formations occur at market tops and inverse head and shoulder formations at bottoms. They frequently tell of the reversal of the trend. Occasionally they fail; their very failure foretells of continuation of the trend but usually on a structurally less sound foundation. To avoid being fooled by the market and the price chart pay particular attention to the associated volume. It must have the following volume characteristics. The development of the left shoulder should be accompanied by the heaviest volume, diminish on its completion and then expand again on development of the head. This second surge of volume is usually less than that during the development of the left shoulder. Volume then contracts and this decreased volume should persist throughout the development of the right shoulder and then expand as an increase of selling make itself evident on collapse of the right shoulder and downside violation of the neckline. This represents the selling of hopes unrealized when prices failed to reach their previous high. The smart money has completed distribution to the unsuspecting.
Similar volume characteristics accompany the inverse head and shoulders formation of bear market bottoms. Heavy volume on the development of the left shoulder and head, declining volume on development of the right shoulder with an increase of volume on the breakout above the neckline. When prices failed to reach the previous low, observant investors take up early accumulative positions, willingly buying from fleeing, uninformed, disillusioned holders.
For the purpose of predicting price moves following the reversal of the trend it is customary to draw a line connecting the bottoms of the two shoulders - the neckline. Then the vertical distance from the apex of the head to the neckline represents the minimum reversal to be anticipated from the neckline. Obviously the further the head is from the neckline the larger the corrective price change to be expected. Head and shoulder patterns can be recognized with necklines at any angle not just in the horizontal plane. They can develop in weeks, months or years. The longer they take to develop the longer the ensuing reverse trend will likely last.
Failure of head and shoulder formations:
Occasionally a head and shoulders formation unfolds but prices either fail to penetrate the neckline or do so only momentarily. When this happens the previous main trend resumes, usually in an explosive manner. However, the market structure at this point is invariably weak and the trend continuation, though energetic at the outset, is usually short lived. A short time later, as technical forces finally win out, the trend terminates and reverses. Volume studies are of little help in recognizing the potential for a failed head and shoulder formation.
http://www.tradertalk.net/tutorial/h&s.html
Saturday, April 15, 2006
Head and shoulders top
One of the most reliable reversal signals is a head and shoulders formation. As the name implies, it is created as a result of three congestion areas. The first forms a shoulder, the second the head and the third a second shoulder. The head congestion is above the shoulders, which both form on the same support line and within the same basic range.
In the case of a head and shoulders top, the reversal of a bull market trend is signalled. The projected target lower is the same distance below the neckline as from the neckline to the head. A break of the neckline not only signals a move to the target area, but also confirms the trend change and the start of a new bear market trend.
Rallies are generally associated with increasing volume during a bull market phase, therefore when volume decreases on a market advance it can signal a potential reversal. The head section of the head and shoulders is often accompanied by decreased volume, relative to past advances. The right shoulder, too, often has very light volume associated with it, but the break of the neckline and the subsequent move lower will generally see volume increase.
A break of the neckline will often see price retest the old neckline, which then becomes resistance, prior to the major move lower. As a result there is often a second opportunity to establish a position if you miss the initial neckline break.
http://www.asx.com.au/research/charting/library/head_shoulders.htm
Head and Shoulders Pattern
The head and shoulders pattern is generally regarded as a reversal pattern and it is most often seen in uptrends. It is also most reliable when found in an uptrend as well. Eventually, the market begins to slow down and the forces of supply and demand are generally considered in balance. Sellers come in at the highs (left shoulder) and the downside is probed (beginning neckline.) Buyers soon return to the market and ultimately push through to new highs (head.) However, the new highs are quickly turned back and the downside is tested again (continuing neckline.) Tentative buying re-emerges and the market rallies once more, but fails to take out the previous high. (This last top is considered the right shoulder.) Buying dries up and the market tests the downside yet again. Your trendline for this pattern should be drawn from the beginning neckline to the continuing neckline. (Volume has a greater importance in the head and shoulders pattern in comparison to other patterns. Volume generally follows the price higher on the left shoulder. However, the head is formed on diminished volume indicating the buyers aren't as aggressive as they once were. And on the last rallying attempt-the left shoulder-volume is even lighter than on the head, signaling that the buyers may have exhausted themselves.) New selling comes in and previous buyers get out. The pattern is complete when the market breaks the neckline. (Volume should increase on the breakout.) (Chart examples of head and shoulders patterns using commodity charts.) (Stock charts.)
http://www.chartpatterns.com/headandshoulders.htm
http://www.chartpatterns.com/headandshoulders.htm
Friday, April 14, 2006
Head and Shoulders
This formation is generally seen at the end of long trends. Completion of the formation changes from 1 month to 1 year and it is a very important signal for trend reversal.
Volume is very important for Head and Shoulders formation. The most of the volume occurs under left shoulder and decreases significantly during correction. After pull back, prices start to increase again but the volume is less than that of left shoulder which indicates a weakness .Since the volume is not enough to carry the prices to new highs, a new correction starts. Decreasing volume is the first warning signal for the formation. The right shoulder is the last attempt with lower volume . Breaking of the neck line confirms the Head and Shoulders formation and down trend starts.
http://www.borsanaliz.com/eng/formations.htm
Seksun as requested by Risktaker

Potential shooting star formed on Thursday but no confirmation on Friday. Tiny dragronfly formed with immediate support at 39 cents as shown by the purple dotted line. Next support is 38 cents. RSI and Stochastics are both turning up. Immediate resistance is 40 cents. Next resistance is 41 cents. Most probably will trade between 39 cents to 41 cents the next few days.
Thursday, April 13, 2006
The Head-and-Shoulders Formation
Have you ever lost money suffering through a head-and-shoulders reversal? Here's a primer on one of the better-known chart patterns that signal major bottoms and tops.
I was doing research in the public library when a staffer asked me if I could help an elderly lady find a chart of TWA [TWA]. The investment materials are sparse at the library and the periodicals that were available didn't have what she needed. The library does have an Internet connection, however, so we went surfing looking for a Web page to chart the stock. Within minutes, we had printed out what she was looking for.
Before the ink was dry, she asked me if I knew anything about charts. I told her I did, a little, at which she pointed to the printout and asked, "Is that a double top?" (Figure 1). That was when I looked at the chart and immediately noticed a head-and-shoulders formation. She was, she told me, considering either adding to her position or selling it completely: A typical investor quandary. Figure 1 shows how unlucky she was at having purchased her first lot in early 1996 and riding the head-and-shoulders reversal down. The stock recently changed hands at about $6.
CHARACTERISTICS
Sometimes it pays to follow more than one stock in an industry to help gauge its health. Research indicates that industry behavior accounts for 15% to 20% of a stock's price fluctuation. Other factors also influence the stock's price: The economy (30% to 35%), the company (30% to 35%) and other factors (15% to 20%).
http://www.traders.com/Documentation/FEEDbk_docs/Archive/0897/Abstracts_new/Bulkowski/Bulkowski9708.html
Shanghai Asia as requested by Risktaker

An interesting stock that started with a potential cup and handle formation that failed because the handle became too big. It then proceeded to form a mini potential head and shoulder which is too close to the bottom of the base. The volume for both the left shoulder indicated as LS and the head were too low. The volume of the right shoulder RH was very high.Therefore, the formation was invalid. Both RSI and Stochastics are still falling. Immediate support is 19.5 cents. Next support is 19 cents. Immediate resistance is the pink dotted line at 20.5 cents. Will probably trade between 19 cents to 20.5 cents the next few days.
Wednesday, April 12, 2006
Head and Shoulders
Head and Shoulders patterns resemble the upper part of a person's body, specifically a shoulder on either side of a head. The line connecting the left and right armpit is referred to as the neckline.
After a rise in the market, if a formation that looks like a head and shoulders is forming and price breaks through the neckline after completing the right shoulder, this indicates a possibility that a reversal of the price trend may occur. A head and shoulders pattern can also occur at the market bottom. When it is at a bottom the formation is inverted, like someone upside down
Volume is usually highest during the left shoulder formation. As prices slip back, volume recedes, when a second rally forms, volume is again high, the head of the pattern is formed when surging prices and volumes begin to ease and fall back again. The trough between the head and the right shoulder must be below the peak of the left shoulder for the pattern to be considered a head and shoulder pattern. The right shoulder is another rally in prices but typically volume is lower than the volume that created the left shoulder and the head. Once the head and shoulders formation is complete, a breakout down through the neckline can be a good indication that the trend of prices will continue in the direction of the breakout.
Price projections are identified by taking the point or percent change (dependent on the price of the security) between the Head and the Neckline. Then, that amount is projecting from the point of penetration of the neckline in the direction of the penetration after formation of the right shoulder. Price projections are only estimates and should accompany other supporting evidence in developing.
Sometimes head and shoulders patterns can be more apparent on indicators than in price action. The pattern is valid when it occurs on an indicator but does not mean a reversal of the price trend will necessarily occur. Momentum indicators like the MACD shown below can diverge from price for some time and so it is strongly recommended to wait for price reversal to occur before making trading decisions
http://www.trade10.com/Head_Shoulders.html
China Paper as requested by johntan2727
 3rd Inside Day today just waiting to breakout in either direction. RSI hovering around 47%. Stochastics just touching 20% oversold border. Immediate support is 39.5 cents as shown by the blue dotted line. Next support is 38.5 cents. Immediate resistance is 41.5 cents. Gap resistance at 43 cents as indicated by the red line. Chart as per time stamped.
Tuesday, April 11, 2006
What does a classic head and shoulders top look like?
The classic head and shoulders top looks like a human head with shoulders on either side of the head. A perfect example of the pattern has three sharp high points, created by three successive rallies in the price of the stock.
The first point - the left shoulder - occurs as the price of the stock in a rising market hits a high and then falls back. The second point - the head - happens when prices rise to an even higher high and then fall back again. The third point - the right shoulder - occurs when prices rise again but don't hit the high of the head. Prices then fall back again once they have hit the high of the right shoulder. The shoulders are definitely lower than the head and, in a classic formation, are often roughly equal to one another.
A key element of the pattern is the neckline. The neckline is formed by drawing a line connecting two low price points of the formation. The first low point occurs at the end of the left shoulder and the beginning of the uptrend to the head. The second marks the end of the head and the beginning of the upturn to the right shoulder. The neckline can be horizontal or it can slope up or down. However, as Elaine Yager, Director of Technical Analysis at Investec Ernst and Company in New York and a member of Recognia's Board of Advisors points out, a Head and Shoulders Top neckline that is sloping downwards is highly unusual and demonstrates extreme weakness,
The pattern is complete when the support provided by the neckline is "broken." This occurs when the price of the stock, falling from the high point of the right shoulder, moves below the neckline. Technical analysts will often say that the pattern is not confirmed until the price closes below the neckline - it is not enough for it to trade below the neckline.
A classic head and shoulders top has been described above. There are many variations, some of which are described here and can be just as valid as the classic formation. Other factors - including volume and the quality of the breakout - should be considered in conjunction with the pattern itself.
http://www.recognia.com/reference/patterndescr_hst.htm
Head and Shoulders Top
The bearish HEAD AND SHOULDERS pattern is often talked about, but seldom seen. It is a variation of the rounded top, but it has three distinct tops -- the highest top in the middle (head) and lower tops (shoulders) on either side of the head. We have not shown volume here, but ideally volume peaks under each top should be highest under the left shoulder and lowest under the right shoulder.
The "neckline" is drawn under the two bottoms that separate the head from the shoulders. A SELL Signal is given when the neckline is penetrated downward. From that point the estimated downside target is equal to the distance between the top of the head and the neckline.
http://www.decisionpoint.com/TAcourse/HeadShoulders.html
Monday, April 10, 2006
Steve Nison - Japanese Candlesticks Charting
Best-selling author and founder and president of Candlecharts.com, Inc., Steve Nison distinguishes himself by combining Japanese technical analysis with Western technical analysis. Traders' Library is pleased to offer all of Nison’s top-selling titles at savings of up to 50%!
The Candlestick Course
Candlestick Charting Basics (audio)
Beyond Candlesticks
Spec:Beyond Candlesticks/Trading Applications of Japanese Candlestick Charting
Afternoon Session Only
Full Day Workshop
Japanese Candlestick Charting Techniques
Strategies for Profiting with Japanese Candlestick Charts (PAL Version)
Strategies for Profiting with Japanese Candlestick Charts
Nison Bundle: Strategies for Profiting with Japanese Candlesticks / Japanese Candlestick Charting
http://www.traderslibrary.com/seo/steve_nison.html
Sunray - Head and Shoulder Formation

Head and Shoulder formation with double right shoulders RH1 and RH2. Neckline as shown by the red dotted line was broken on 3rd April 2006 and confirmed on 5th April 2006 after remaining below the neckline for 2 days. RSI trending down. Stochastics just entering oversold region. Immediate support is the tail of the tiny dragronfly doji. Next support is 44.5 cent indicated by the green dotted line followed by 43.5 cents shown by the red line. Immediate resistance is 49.5 cents the highs of the 3 bars just after breaking the neckline.Price may sometimes try to move back to the neckline but be alert for further price drop.
Sunday, April 09, 2006
Beyond Candlesticks by Steve Nison
If you found Nison's Japanese Candlestick Charting Techniques helpful, you will find this sequel to be indispensable.Known internationally as `The Father of Candlesticks,' Nison reveals more Japanese charting methods which have never been published or used in the Western world. Describes kagi, renko and three-line break charts. Provides a brief review of candlesticks and previously unavailable candlestick patterns that can be used in equities, fixed-income, foreign exchange and overseas markets.
http://store.yahoo.com/stockcharts/becastni.html
http://store.yahoo.com/stockcharts/becastni.html
Landwind - Bearish Engulfing Pattern
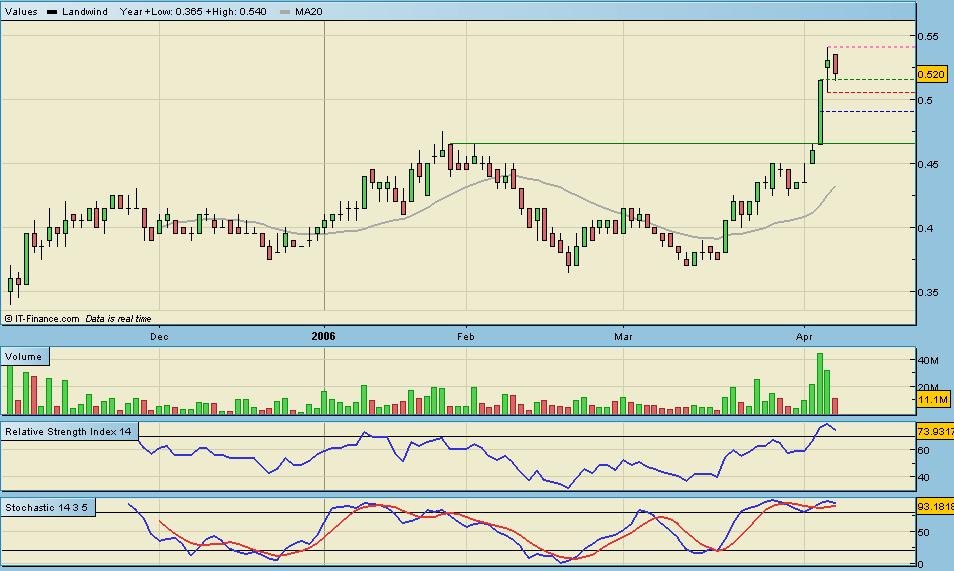
Double bottom formation target price was exceeded and excellent performance recorded. Bearish Engulfing Pattern was formed on Friday. Be nimble and take profit if price retrace further downwards. Both RSI and Stochastics are in oversold region. Immediate support is 51.5 cents as indicated by the green dotted line. Next support is the tail of the potential hanging man pattern formed on Thursday 6th April 2006. Mid White Marubozu candlestick support is the blue dotted line at 49 cents. Immediate resistance is the record high at 54 cents.
Saturday, April 08, 2006
Japanese Candlestick Charting Techniques (Revised Edition) by Steve Nison
Japanese Candlestick Charting Techniques, 2nd Edition, provides an in-depth explanation of candlestick plotting and analysis, conveying to the reader, in easy-to-understand language, the author’s years of practical experience in this increasingly popular and dynamic approach to market analysis. It includes hundreds of examples that span the equity, futures, fixed-income, and foreign exchange markets and shows how candlestick charting techniques can be used in almost any market. It has been thoroughly updated to include:-
New techniques and strategies-
The author’s concept of the Convergence (when a series of signals converge at one zone, thus increasing the chances for a market turn from that area)
This new edition broadens the book’s focus and all new updated charts, and information on several new areas such as day trading and how candlestick charting can be used to improve returns and help decrease market risk.
It includes everything from the basics, such as constructing the candlesticks and learning the patterns, to advanced topics, such as the rules of multiple technical techniques.
http://store.yahoo.com/stockcharts/jacachtereds.html
Engulfing Patterns
There are three criteria for an engulfing pattern:
1. The market has to be in a clearly definable uptrend for a bearish engulfing pattern or downtrend for a bullish engulfing pattern, even if the trend is short term
2. Two candles comprise the engulfing pattern. The second real body must engulf the prior real body. It need not engulf the shadows.
3. The second real body of the engulfing pattern should be the opposite color of the first real body. The exception to this rule is if the first real body of the engulfing pattern is a doji.
Some factors increasing the likelihood that an engulfing pattern could be an important turning signal are:
1. If the first day of the engulfing pattern has a very small real body (for instance, a spinning top) and the second day has a very long real body.
2. If the engulfing pattern appears after a protracted or very fast move.
3. If there is a heavy volume on the second real body of the engulfing pattern.
http://www.mglider.com/engulfing_patterns
Friday, April 07, 2006
VOODOO TRADING
Voodoo trading could add a lot to your bottom line. W.D. Gann, R.N. Elliott and other cultists spent years studying the market's mystical side, trying to figure out how obscure ideas could tap hidden profits. Magic numbers, astrological dates and prayer wheels have all been enlisted in the search for that elusive trading edge.
Most traders believe Fibonacci fits in the category of market witchcraft, but this arcane science has a basis in fact. A 12th century monk known as Fibonacci discovered a logical sequence that appears throughout nature. Beginning with 1 + 1, the sum of the last two numbers that precede it creates another Fibonacci number. For example: 1+1=2, 1+2=3, 2+3=5, 3+5=8, 5+8=13, 8+13=21, 13+21=34, 21+34=55, etc.
Major ratios between Fibonacci numbers identify expected retracement levels, as markets pull back after rallies or selloffs. The most common Fib retracements are 38%, 50% and 62% of the principal price movement. These are price levels where many traders expect important reversals and bounces. For obvious reasons, these also represent entry signals in many short-term strategies.
Fibonacci patterns and the Elliott Wave are kissing cousins. According to Elliott, major rallies or selloffs occur in three primary waves, with two countertrend waves in between. These waves are often boxed into major retracement levels. Go back and look at my article "Mind the Gaps." Notice how Fibonacci retracements can also define levels where markets jump from one price to another.
http://www.hardrightedge.com/wheel/hrevoodoo.htm
Short-Term Chart Patterns
In Basic Chart Analysis: Trends, Trading Ranges, and Support and Resistance and Chart Classics: Reversal And Continuation Patterns, we discussed the fundamental principles of chart analysis and the trading implications of many of the better-known chart patterns. While most of these consist of five or more bars, many chart "patterns" contain only one to three bars and are of special interest to traders since they are associated with short-term price extremes.
Gaps, spikes, wide-range days, and reversal days and are some of the more popular examples of this group. Like their longer-term cousins, these patterns are subject to a great deal of misinterpretation--which can be eliminated by remembering a few simple rules. We'll explain these patterns and show you how to make sense of them.
One-day wonders
Gaps
A gap occurs when today's low is higher than yesterday's high or today's high is lower than yesterday's low, forming an open (vertical) space between bars. An opening gap refers to an opening price that falls outside the range of the previous day's bar.
Gaps are quite common, and are often no more than relatively meaningless reactions to news events (or rumors); these can be exaggerated in thinly traded or highly volatile markets. For the most part, gaps that occur in choppy or trading range markets are less significant than those that occur when markets embark on a new price move or during an accelerated phase of a price move (e.g., a "parabolic" rally or decline).
When markets are moving with great force, they will often gap from one day to the next. So, on one hand, gaps can be evidence of a strong trend or runaway move (the reason gaps in these situations are called "runaway" gaps). On the other hand, gaps can be evidence of price exhaustion at the end of a trend, and can present opportunities to take positions in the opposite direction of the gap ("fading" the gap).
Similarly, opening gaps sometimes present opportunities to trade counter to the direction of the gap after the initial selling or buying "panic" subsides and the market reverses. There are many reasons this can happen--the release of an early morning economic report, or an earnings announcement the previous evening; for some examples, see Kevin Haggerty's article on Opening Reversals and the definition of his Trap Door trade.
http://www.investopedia.com/university/tm/TradingPatterns/ShortTermChartPatterns.asp
Thursday, April 06, 2006
CWT as requested by magicgate

From $1.05 to $1.24 within 5 days. Immediate support is $1.20. Next support is the blue dotted line at $1.17. Gap support is $1.13. RSI and Stochastics are both weakening in oversold region. Immediate resistance is $1.24. Next resistance is $1.31 as shown by the red line. The reference point of the red resistance line is not shown in the chart. Will probably trade between $1.24 to $1.17 the next few days. Chart as per time stamped.
Wednesday, April 05, 2006
Food Empire Weekly Chart as requested by Prime
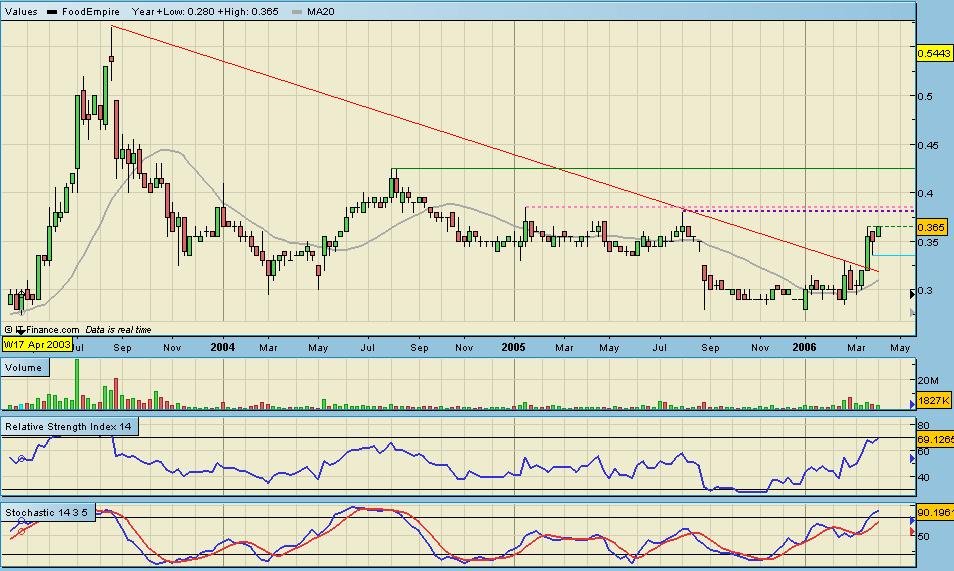
Broke out from downtrend and estblishing new uptrend. RSI hovering near 70% overbought border. Stochastics in overbought region.Immediate resistance is 36.5 cents. Next resistance band is 38 cents and 38.5 cents. Breakout from this resistance band will see retest of 42.5 cents resistance as shown by the green line. Immediate support is the light blue line at 33.5 cents.
Guthrie as requested by Prime
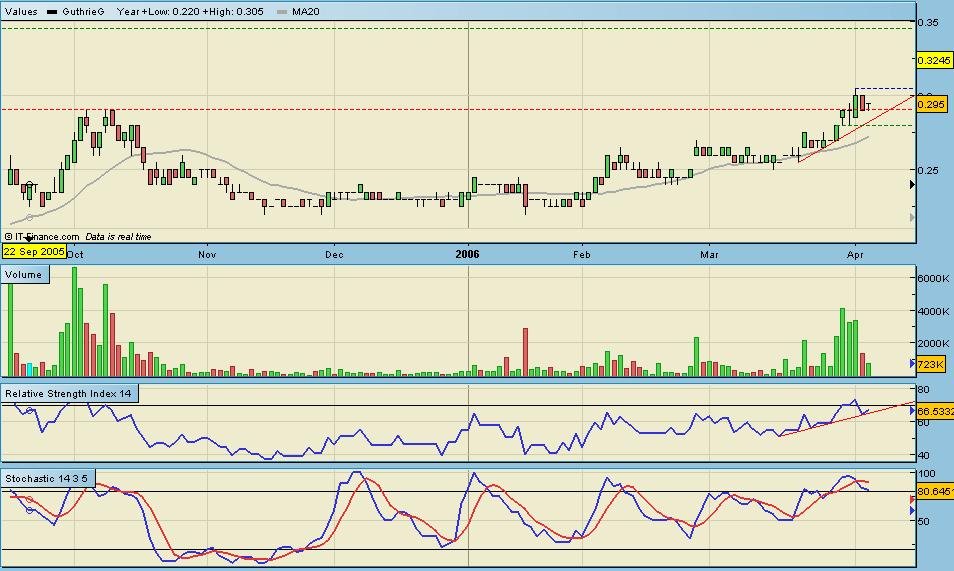
As at 12.30pm lunch time closing, a dragronfly doji siiting on the red dotted line support at 29 cents was spotted. RSI still in uptrend. Stochastics dropping but still inside overbought region. Volume dropping. Immediate support is 29 cents. Next support is 28 cents indicated by the bottom green dotted line. Immediate resistance is 30.5 cents. Breakout above 30.5 cents will see a retest of 34.5 cents as shown by upper green dotted line.
Stamford Land as requested by Prime

Broke out of short term downtrend line as shown by the red line. RSI still flat and hovering around the 50% range. Stochastics trending upwards steadily. Immediate resistance is 31 cents follwed by resistance at every bid level until 32.5 cents. Immediate support is 30.5 cents. Next support is 30 cents. Need lots of patience for this stock.
Tuesday, April 04, 2006
Technical Analysis: Introduction
The methods used to analyze and predict the performance of a company's stock fall into two broad categories: fundamental and technical analysis. Those who use technical analysis look for peaks, bottoms, trends, patterns and other factors affecting a stock's price movement and then make buy/sell decisions based on those factors. It is a technique many people attempt, but few are truly successful at it.
The world of technical analysis is huge today. There are literally hundreds of different patterns and indicators that investors claim to have success with. We have tried to keep this tutorial as short as possible. Our goal is to introduce you to the different types of stock charts and the various technical analysis tools available to investors.
http://www.investopedia.com/university/technical/
Aus Group

Second attempt at breaking out of ascending triangle resistance at 32.5 cents being observed. Higher lows were formed after each upward movement. RSI just turned upwards. Stochastics still dropping. Immediate support is 30.5 cents. Next support is 29.5 cents. Immediate resistance is 32.5 cents as shown by the blue dotted line. Next resistance is the green dotted line at 34.5 cents. High chance of breaking 32.5 cents. Lets see if the market concurs. Interesting days ahead. Reassessment will be done after breakdown of red bold uptrend line or breakout of blue dotted line resistance. Chart as per time stamped.
Monday, April 03, 2006
Guerrilla Trading Tactics: Tools for Today’s Active & Short-Term Investors
Reap large market gains - consistently - when you master the unique market style of Oliver Velez, called “Guerrilla Trading”. Practiced by the world's most successful short-term traders, this “hit and run” market move gets you in and out of trades quickly - at the right times - with profits in tow. 50 + pages of online material are available at ..traderslibrary.com/tradesecrets .
Even veteran market professionals admit that today's investment arena is more confusing than ever before. Market trends, if they develop at all, tend to be short-lived, and fundamental valuations are frequently invalid. So what can you do to succeed in such a chaotic financial environment?
Adopt a “guerrilla” style of trading. Forget long-term thinking. Abandon buy-and-hold strategies. Instead, hit the market with quick, profit-grabbing attacks. Relying on time-tested technical trading patterns for entry and exit cues, Oliver Velez shows how to raid the markets for consistent short-term profits using “guerilla” tactics that boast historic success rates of 80% or more - and now he shares these winning market moves with you.
Don't keep making the same old mistakes with the same old techniques. Join Oliver Velez today and learn ... o How to handle a market without a recognizable trend. o 13 best tactics in the guerrilla trader's arsenal. o 2 key strategy approaches: trading to build wealth or trading for income. o Special tactics for playing excess volatility - and for stable markets. o Micro trading, the elements of swing trading, candlestick charts, bullish and bearish chart patterns - and more!
http://www.invest-store.com/stockta/
About Stock Technical Analysis.com StockTA.com
Stock Technical analysis is a free technical analysis and stock screener website devoted to teaching and utilizing the fine art of stock technical analysis to optimize your stock trades. Inside you will find free automated technical stock and mutual fund analysis, free delayed charts, , free level II stock quotes, free fibonacci numbers, free stock opinions and free stock profiles, Looking for stocks that are bullish, or bearish? check out the free stock screening page, one of the most advanced free stock screeners on the web. Learn about technical analysis tools like Fibonacci numbers candlestick charting, or find books, on technical analysis.
http://www.stockta.com/
http://www.stockta.com/
![]()